
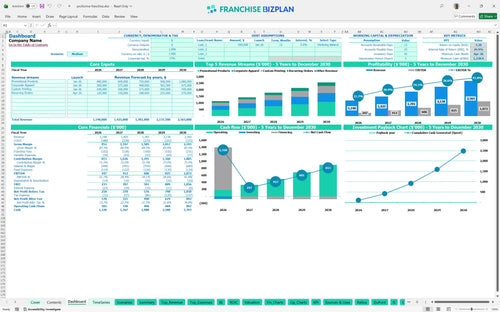
All-in-one Dashboard
Core inputs and core outputs


This franchise financial model template for Excel includes a 5-year P&L statement, a franchise startup cost calculator, and detailed revenue drivers for the promotional products franchise business model.
Core inputs and core outputs
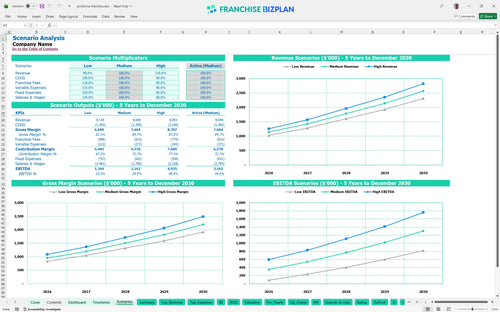
Three scenario analysis
Presentation ready
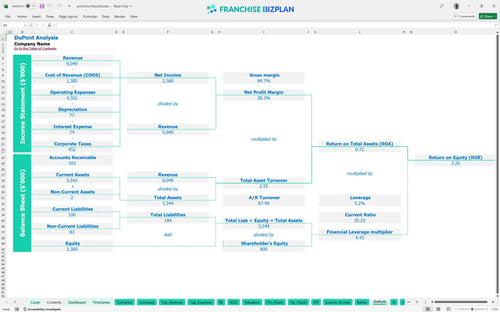
DuPont analysis
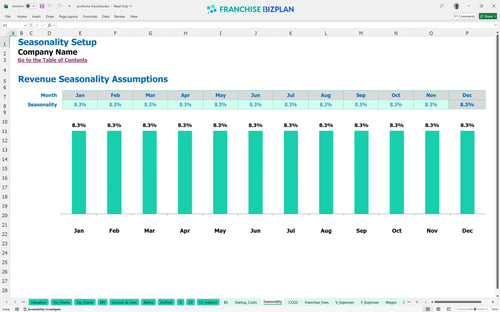
Researched revenue assumptions
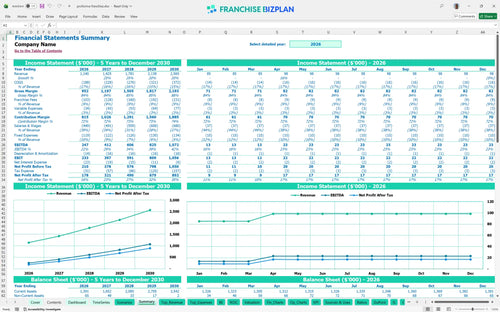
Lender-friendly financial outputs
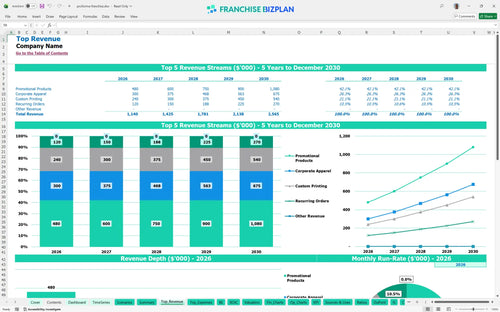
Revenue stream detailed view
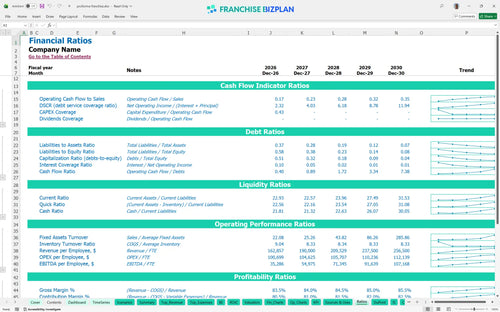
Performance metrics benchmark
We built this franchise unit financial model using our own research on B2B marketing franchise unit economics. Key assumptions like the 8% royalty, $35,000 franchise fee, and $1.14 million year-one revenue are pre-populated and fully editable. This tool helps you see how a $1.07 million EBITDA is possible by year five with the right staffing.
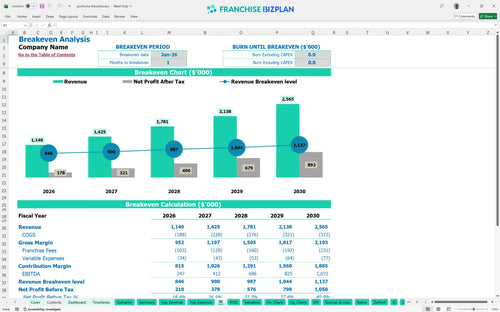
This franchise unit hits its break-even point in January 2026, just one month after opening. Here's the quick math: with a $1.14 million year-one revenue and 14% COGS, you cover your $10,100 monthly fixed costs almost instantly. Profitability isn't just about sales; it's about what you keep after the 8% royalty.
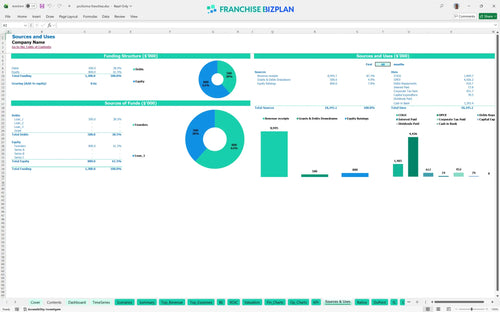
You need $78,500 in upfront capital to cover the franchise fee and equipment, plus a cash buffer for the ramp-up. Most of this goes toward the $35,000 initial fee and $12,000 in leasehold improvements for your Austin command center. Capital is the fuel for your franchise engine.
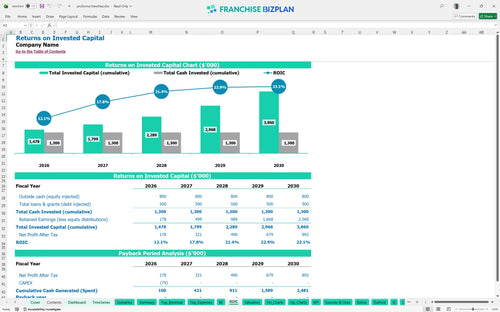
The internal rate of return (IRR) is 26.89%, with a return on equity (ROE) of 3.2. What this estimate hides is that while payback occurs after year five, the $1.07 million EBITDA (earnings before interest, taxes, depreciation, and amortization) in year five creates significant resale value. ROI is the only metric that truly measures success.
Break-even occurs in month one because the average ticket for promotional products and corporate apparel is high enough to offset the 9% combined royalty and marketing fees. Speed to break-even is the best indicator of a healthy unit.
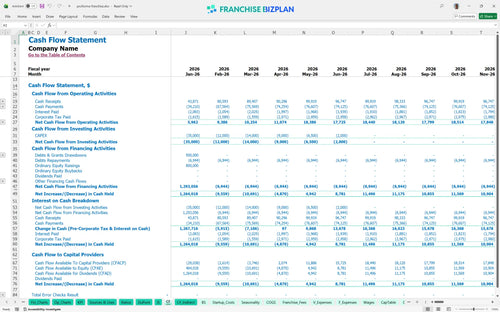
Your lowest cash point is $1,239,000 in April 2026, which assumes you start with significant liquidity to fund the initial team. How to build a franchise financial model requires looking at this 'valley' to ensure you don't run out of money during the ramp-up of your sales team. Cash is king, especially during the first six months.
The high scenario projects year-five revenue at $2.56 million, which significantly improves your store-level margin. Moving from low to high depends on your sales reps hitting their targets and keeping COGS near the 12% benchmark. Plan for the best, but prepare for the rest.
This franchise financial model is built in Excel with open formulas, allowing you to adjust every assumption for your specific territory. You can tweak the $35,000 franchise fee or change the 8% royalty rate to see how different deal terms impact your bottom line. Control your numbers before you sign the agreement.

Plan your growth from $1.14 million in year one to over $2.5 million by year five using these detailed franchise financial projections. This franchise business plan template provides a roadmap for scaling your B2B marketing franchise financial plan, tracking how EBITDA grows from $247,000 to $1.07 million as you gain efficiency. Growth is a choice, but planning for it is a requirement.

Managing the 8% royalty and 1% marketing fee is critical for maintaining your store-level margin. This franchise unit profit and loss template calculates these costs automatically based on your sales of promotional products and corporate apparel, so you always know your true net. Royalties are a top-line tax; treat them with respect.

Use the franchise startup cost calculator to map out your initial $78,500 CAPEX (capital expenditures), including leasehold improvements and printing equipment. Calculating break-even point for a franchise is simple here; the model shows you exactly what volume is needed to cover your $10,100 in monthly fixed operating expenses. Knowing your floor is as important as knowing your ceiling.

This franchise profitability analysis includes built-in benchmarks for COGS (Cost of Goods Sold), which starts at 14% and scales down to 12% by year five. These targets help you stay competitive in commercial printing franchise financial projections while ensuring your sales reps stay productive. Don't guess when you can use proven data.


Simply purchase and download the financial model template, then access it instantly using Microsoft Excel or Google Sheets. No installation or technical expertise required-just open and start working.

Enter your business-specific numbers, including revenue projections, costs, and investment details. The pre-built formulas will automatically calculate financial insights, saving you time and effort.

Leverage the investor-ready format to confidently showcase your financial projections to banks, franchise representatives, or investors. Impress stakeholders with clear, data-driven insights and professional reports.

Leverage the investor-ready format to confidently present your projections to banks, franchise representatives, or investors.