
All-in-one Dashboard
Core inputs and core outputs


This franchise unit financial projection spreadsheet provides a detailed 5-year outlook covering startup CAPEX, membership revenue, labor scaling, and royalty obligations to ensure a successful launch.
Core inputs and core outputs
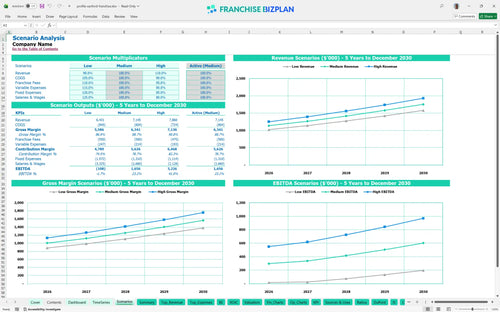
Three scenario analysis
Presentation ready
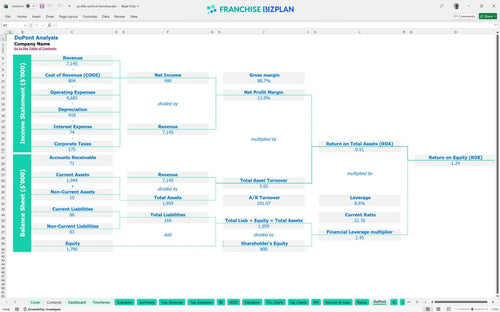
DuPont analysis
Researched revenue assumptions
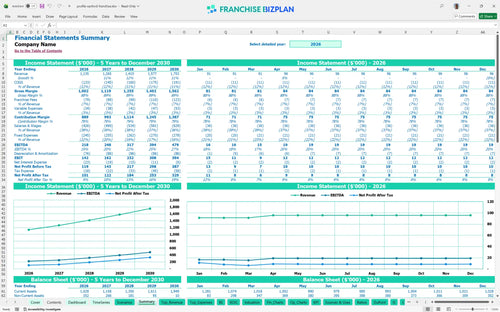
Lender-friendly financial outputs
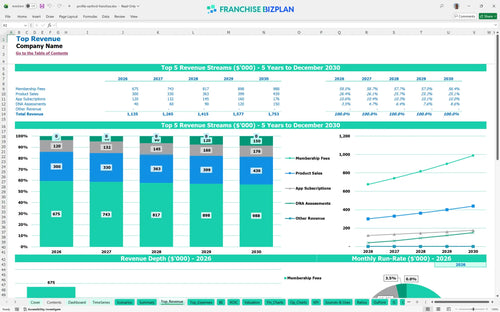
Revenue stream detailed view
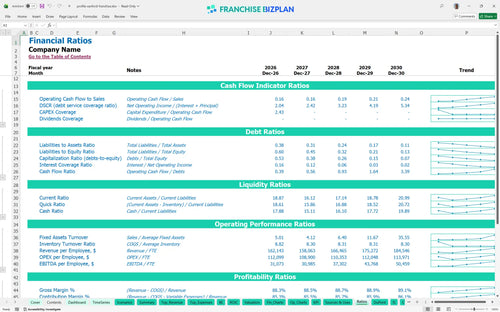
Performance metrics benchmark
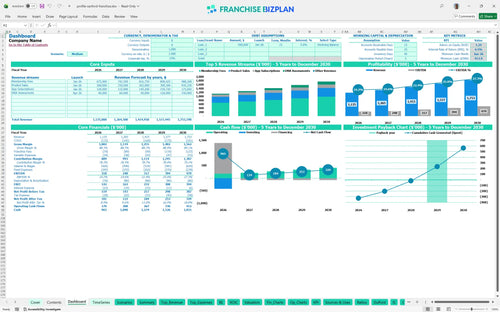
We built this franchise unit financial model using our own research to help you navigate the first five years of operation. Key assumptions like the $450,000 year-one membership revenue and $14,000 monthly rent are pre-populated and fully editable. Here's the quick math: with a 4-year payback and 4.51% IRR, this is a long-term play that requires tight control over your $218,000 year-one EBITDA.
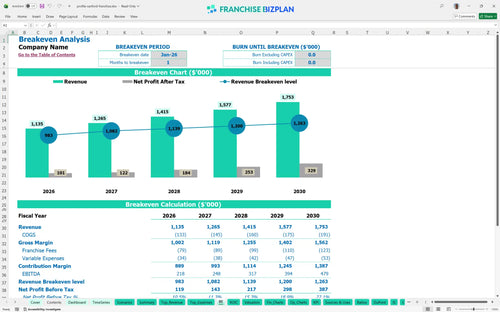
The unit reaches profitability almost immediately, with a break-even date of January 2026. While year-one EBITDA starts at $218,000, it scales to $479,000 by year five as DNA assessments and app subscriptions defintely add high-margin layers to the core membership base.
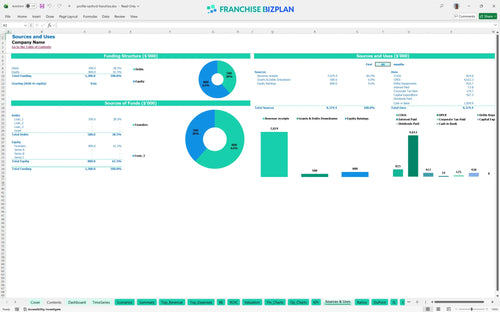
You need roughly $427,500 in upfront CAPEX to get the doors open, plus a significant cash reserve. This franchise investment analysis for medical weight loss clinics shows the largest chunk goes toward leasehold improvements and the initial franchise fee to ensure the facility meets brand standards.
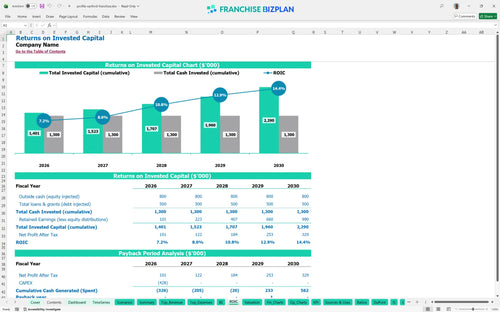
Investors can expect an IRR of 4.51% and a 4-year payback period on the initial outlay. While the ROE of 1.24 shows steady performance, the real value lies in the growing EBITDA which more than doubles between year one and year five, according to our ROI analysis.
The model shows a break-even point in the very first month, January 2026. This is driven by the $450,000 initial membership revenue base, but staying above water depends heavily on managing the $14,000 monthly rent and the 7% combined royalty and marketing fee burden.
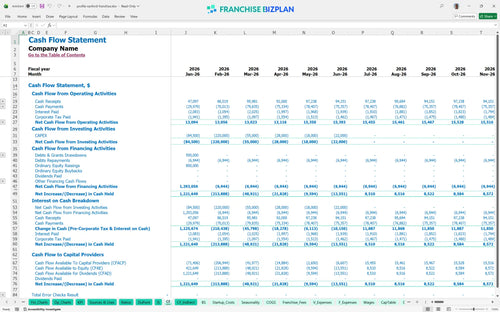
The lowest cash point occurs in June 2026 at $914,000, suggesting you need a substantial liquidity buffer to handle the ramp-up. Even with early break-even, the timing of equipment payments and staffing increases for health coaches can squeeze your operating account quickly.
Shifting between Low, Medium, and High cases will primarily impact your year-one $218,000 EBITDA. A 10% drop in membership fees or a spike in labor costs for your five health coaches can push the 4-year payback out significantly, making local marketing execution critical.
Finance: update unit break-even and payback model by Friday.
This franchise financial model template is built in Excel with open formulas, allowing you to tweak every assumption from membership growth to retail margins. You can adjust the local rent or staffing levels to see how they impact your bottom line before signing a lease or committing to a territory.

Map out your path from a $1,135,000 year-one revenue to a projected $1,753,000 by year five. This long-term view helps you plan for scaling health coach headcounts and managing the 5% royalty fee as your volume grows, ensuring you understand the health and wellness franchise profitability over time.

The model bakes in the 5% royalty and 2% marketing fund contributions directly into your cash flow forecasting. By accounting for these off the top, you get a realistic view of your store-level EBITDA after the franchisor takes their cut, which is vital for analyzing franchise royalty and marketing fees.

Total startup costs hit approximately $427,500, including the $49,500 initial fee and $220,000 for leasehold improvements. Knowing your break-even revenue helps you manage the early days when membership fees are still ramping up, providing a clear franchise investment calculator for your launch.

Use built-in benchmarks to verify if your $14,000 monthly rent or 10.5% retail product costs are in line with the market. It's a sanity check for your franchise business plan Excel, helping you compare your unit economics against typical wellness center performance.


Simply purchase and download the financial model template, then access it instantly using Microsoft Excel or Google Sheets. No installation or technical expertise required-just open and start working.

Enter your business-specific numbers, including revenue projections, costs, and investment details. The pre-built formulas will automatically calculate financial insights, saving you time and effort.

Leverage the investor-ready format to confidently showcase your financial projections to banks, franchise representatives, or investors. Impress stakeholders with clear, data-driven insights and professional reports.

Leverage the investor-ready format to confidently present your projections to banks, franchise representatives, or investors.