
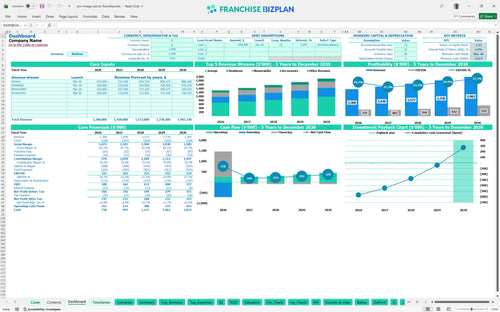
All-in-one Dashboard
Core inputs and core outputs


This sports apparel retail store financial model provides a complete toolkit to forecast revenue, manage expenses, and calculate ROI for a new location.
Core inputs and core outputs
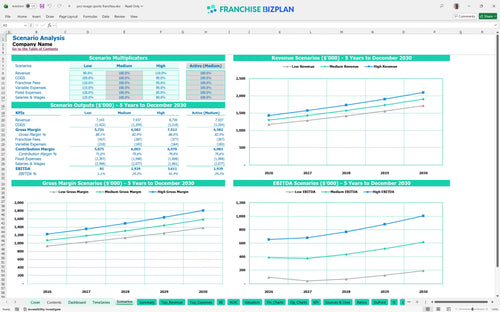
Three scenario analysis
Presentation ready
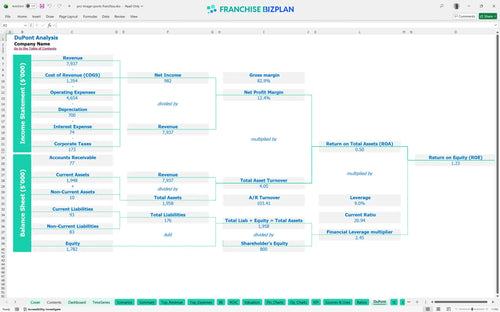
DuPont analysis
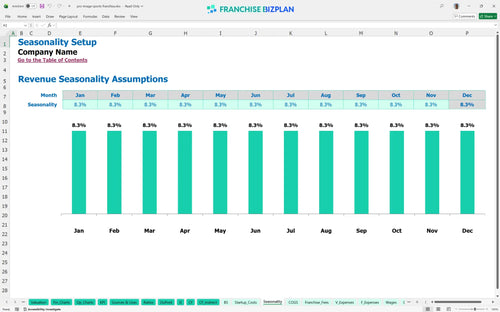
Researched revenue assumptions
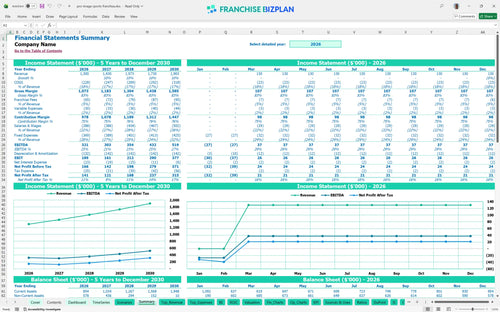
Lender-friendly financial outputs
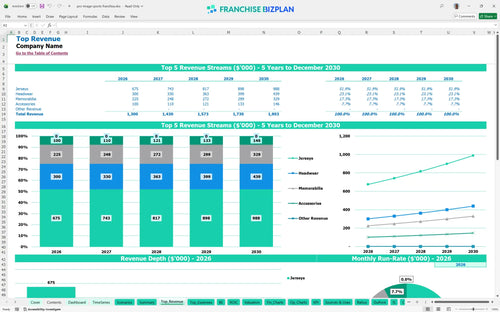
Revenue stream detailed view
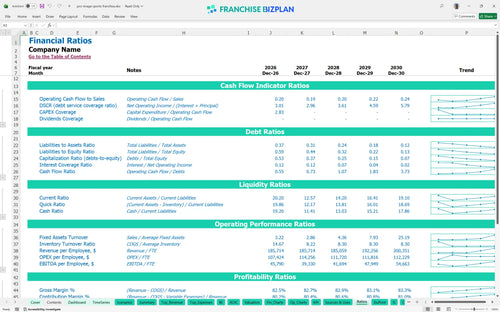
Performance metrics benchmark
We built this franchise unit financial model using our own research into the sports retail sector. Key assumptions, including the $1.3 million year-one revenue and $25,000 monthly rent, are pre-populated and fully editable to match your specific site. This tool defintely helps you understand how to calculate startup costs for a retail franchise without the guesswork.
The unit is projected to be profitable in its first year, generating $321,000 in EBITDA. As revenue scales toward $1.9 million by year five, net profit grows steadily alongside it. Efficiency is the name of the game here.
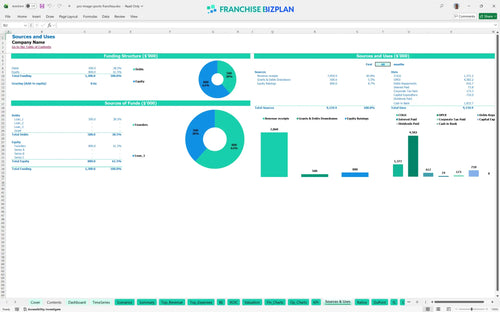
You need a total initial investment of approximately $710,000 to cover the startup cost breakdown for sports retail franchise operations. This includes the $30,000 franchise fee, $250,000 for build-out, and $180,000 for your initial inventory of jerseys and headwear.
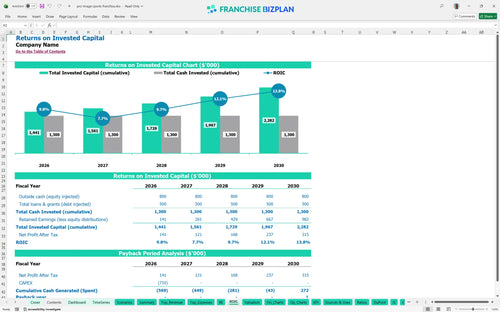
The return on investment calculation shows a 5-year payback period and an Internal Rate of Return (IRR) of 3.01%. With a Return on Equity (ROE) of 1.23, the model demonstrates a stable, albeit long-term, recovery of your initial capital.
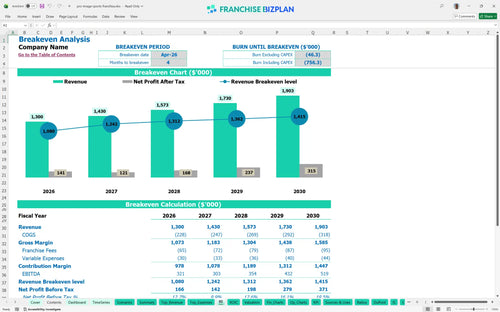
The unit reaches break-even in April 2026, just four months after launching. To hit this, you must manage the $25,000 monthly rent and 5% royalty fee by maintaining high throughput during local game days. Here is how to analyze franchise unit economics effectively.
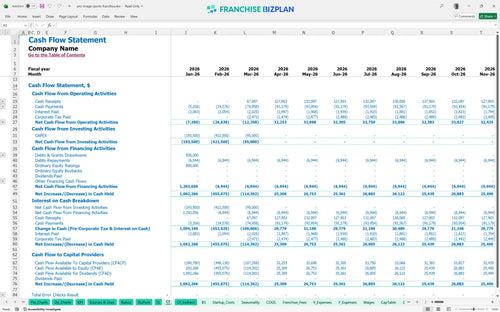
The lowest cash point is $523,000 in March 2026, immediately following the heavy capital expenditure budget for build-out and inventory. You need a solid cash buffer to handle the ramp-up phase before the $1.3 million annual revenue fully kicks in.
Using the Excel template for franchise financial forecasting, you can toggle between Low, Medium, and High cases. A high-performance scenario sees EBITDA climb to $519,000, while the low case tests your ability to cover the $75,000 manager salary during slow months.
This franchise financial model template is fully customizable in Excel, featuring pre-filled formulas and editable assumptions that adapt to your specific territory and local market conditions. You can adjust everything from seasonal sales spikes to local labor rates, ensuring your sports store financial projection reflects the actual costs of doing business in your chosen city.

Planning for the long term is essential for any retail franchise business plan. This model provides a detailed 5-year outlook, showing how revenue grows from $1.3 million in year one to over $1.9 million by year five, while tracking the impact of rising inventory needs and staffing requirements as you scale.

The model simplifies franchise disclosure document analysis by automating the calculation of your financial obligations. It tracks the 5% royalty fee against monthly sales and manages the initial $30,000 franchise fee, so you can see exactly how much cash stays in the business after meeting your brand standards.

Use the built-in franchise startup cost calculator to map out your initial investment, including the $250,000 for leasehold improvements and $180,000 for opening inventory. The model determines the exact sales volume needed to cover your $25,000 monthly rent and other fixed costs, providing a clear path to self-sufficiency.

This retail franchise profitability analysis incorporates industry-standard benchmarks for labor, rent, and cost of goods sold. By comparing your projected 15.5% merchandise cost against typical retail averages, you can sanity-check your assumptions and identify potential margin leaks before you sign a lease.


Simply purchase and download the financial model template, then access it instantly using Microsoft Excel or Google Sheets. No installation or technical expertise required-just open and start working.

Enter your business-specific numbers, including revenue projections, costs, and investment details. The pre-built formulas will automatically calculate financial insights, saving you time and effort.

Leverage the investor-ready format to confidently showcase your financial projections to banks, franchise representatives, or investors. Impress stakeholders with clear, data-driven insights and professional reports.

Leverage the investor-ready format to confidently present your projections to banks, franchise representatives, or investors.