
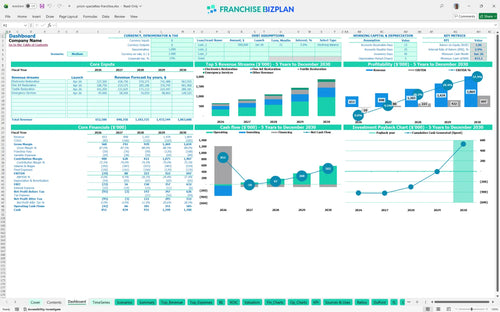
All-in-one Dashboard
Core inputs and core outputs


This financial model template for cleaning and restoration businesses provides a comprehensive toolkit for analyzing unit-level performance and long-term viability.
Core inputs and core outputs
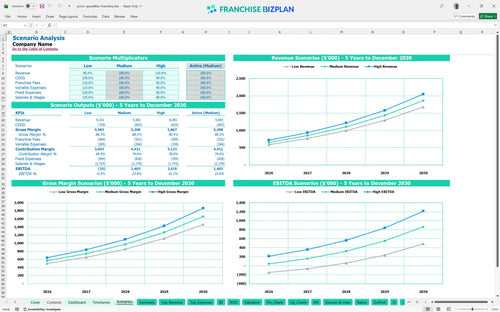
Three scenario analysis
Presentation ready
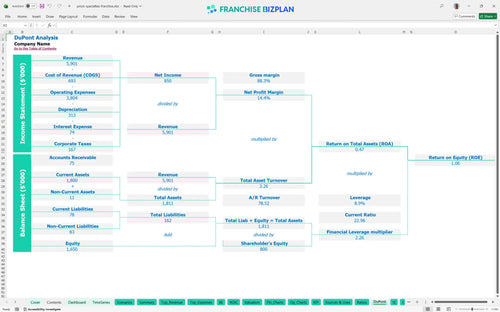
DuPont analysis
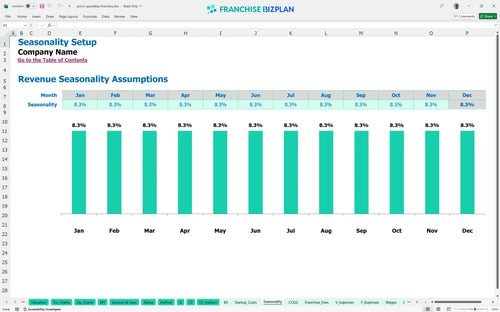
Researched revenue assumptions
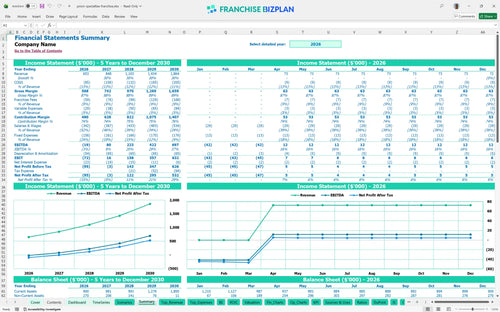
Lender-friendly financial outputs
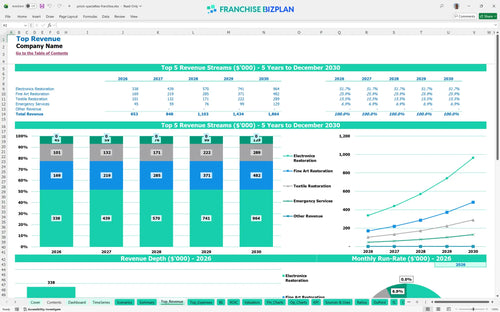
Revenue stream detailed view
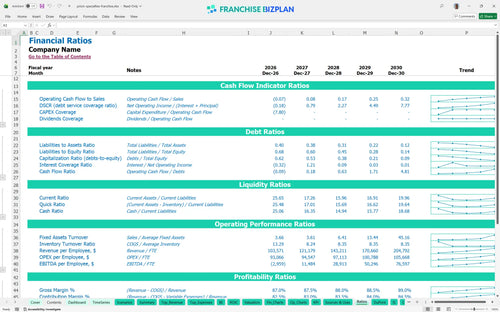
Performance metrics benchmark
We developed this franchise unit financial model using detailed research on specialized restoration services. Key assumptions including revenue streams from electronics and art, $324,000 in capital investments, and a 7% royalty structure are pre-populated and fully editable to match your specific territory. With year-five revenue projected at $1.86 million and a 5-month break-even, the model provides a data-driven look at the business potential.
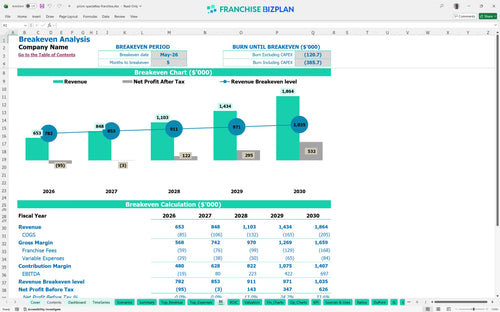
The unit reaches monthly profitability in May 2026, just five months after the April launch. While year one shows a slight EBITDA loss of $19,000, the business defintely gains momentum, reaching $80,000 in year two and $697,000 by year five as you scale your franchise profitability analysis. This estimating profitability for specialized restoration services shows a strong upward trajectory as high-margin art and electronics claims increase.
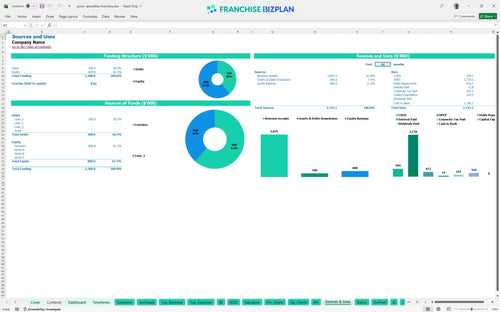
You need approximately $324,000 in startup capital for equipment and build-out, plus a significant cash buffer for the ramp-up phase. This capital expenditure planning includes $95,000 for leasehold improvements and $65,000 for diagnostic tools, all tracked within this Excel spreadsheet for franchise startup financial planning.
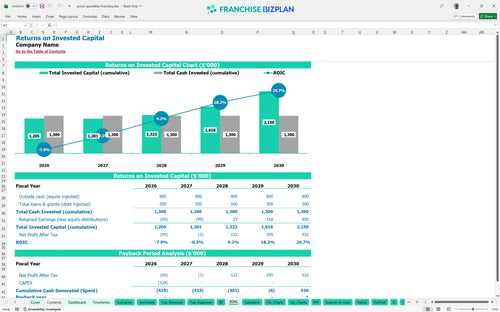
Investors can expect a 2.87% IRR and a full payback of the initial investment within 5 years. This ROI analysis for franchises highlights that while the initial cash outlay is significant, the year-five EBITDA of $697,000 creates a strong terminal value for the operator.
The monthly break-even point is reached when revenue covers the $13,000 in fixed costs and associated variable expenses. Learning how to build a budget for a new franchise unit is critical here, as electronics restoration volume is the primary driver for hitting this threshold by May 2026.
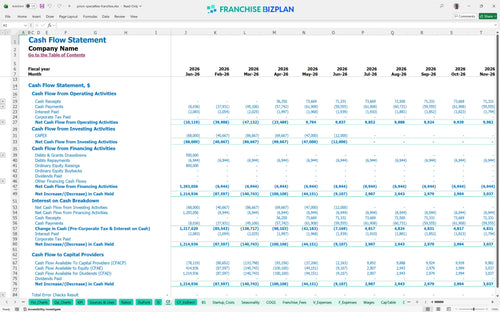
The lowest cash point occurs in June 2026 at $833,000, requiring careful management of working capital during the first quarter of operations. Your operating expense forecasting must account for the timing gap between completing high-precision restoration work and receiving insurance payouts.
High-performance scenarios show year-five EBITDA reaching $697,000 if revenue scales at the projected 30% annual rate. Financial forecasting for insurance-based service franchises requires looking at how a 10% swing in claim volume impacts your ability to fund the $833,000 minimum cash requirement.
This franchise unit financial model template is a fully editable Excel tool designed to map out the unit economics of a specialized restoration business. You can adjust pre-filled formulas and assumptions to match your specific territory, ensuring the projections reflect local labor rates and rent costs.

You can project five years of financial performance, starting from an initial $653,000 in revenue during year one and scaling to over $1.86 million by year five. This business financial projection spreadsheet provides a clear view of long-term profitability, including detailed EBITDA and cash flow tracking as the unit matures. This pro forma financial statement template for franchise owners helps you visualize the transition from ramp-up to a steady state.

The model automatically calculates your 7% royalty and 2% marketing fund contributions based on gross sales to ensure you see the true store-level margin. This franchise business plan financial projections Excel tool captures these franchise-specific obligations alongside the initial $49,000 fee, so there are no surprises in your franchise royalty fee calculation.

Total restoration business startup costs include a $49,000 franchise fee and $95,000 in leasehold improvements, with a clear path to a break-even point analysis by month five. This helps you understand how to calculate startup costs for a restoration franchise while identifying the exact sales volume needed to cover your $13,000 in monthly fixed overhead.

We use real-world data like $6,500 monthly rent and technician salaries starting at $39,000 to keep your restoration franchise unit economics and margin analysis grounded in reality. These built-in benchmarks allow you to sanity-check your assumptions when analyzing operational overhead for restoration franchises against typical industry ranges.


Simply purchase and download the financial model template, then access it instantly using Microsoft Excel or Google Sheets. No installation or technical expertise required-just open and start working.

Enter your business-specific numbers, including revenue projections, costs, and investment details. The pre-built formulas will automatically calculate financial insights, saving you time and effort.

Leverage the investor-ready format to confidently showcase your financial projections to banks, franchise representatives, or investors. Impress stakeholders with clear, data-driven insights and professional reports.

Leverage the investor-ready format to confidently present your projections to banks, franchise representatives, or investors.