
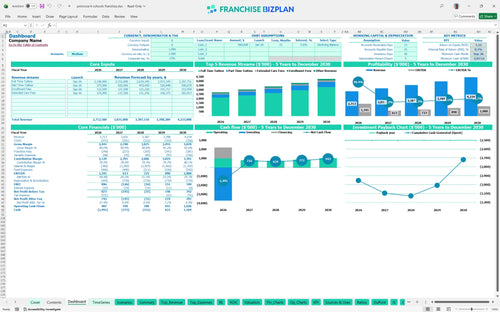
All-in-one Dashboard
Core inputs and core outputs


This comprehensive Excel template provides a professional-grade framework for forecasting revenue, expenses, and investment returns for a premium childcare franchise unit.
Core inputs and core outputs
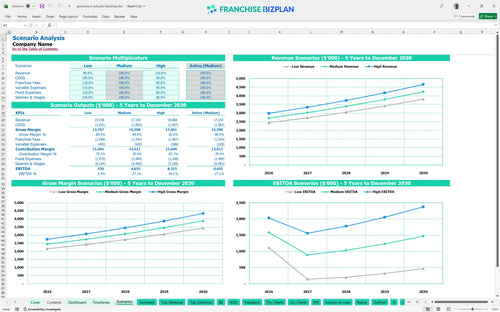
Three scenario analysis
Presentation ready
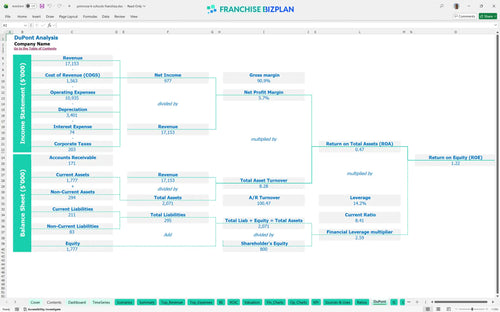
DuPont analysis
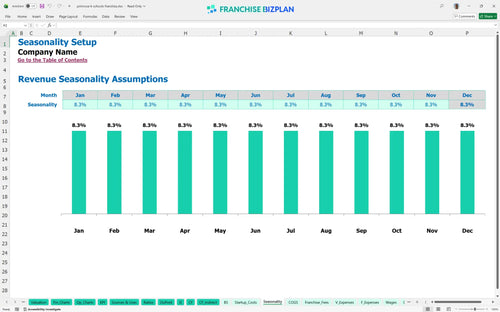
Researched revenue assumptions
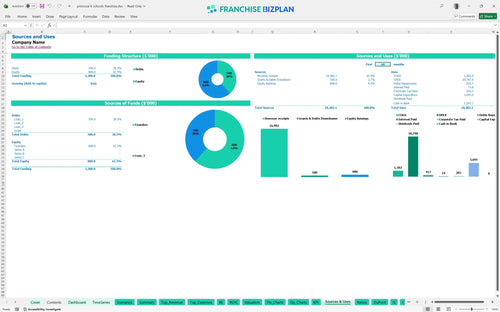
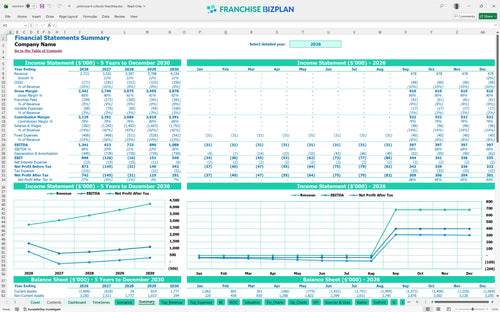
Lender-friendly financial outputs
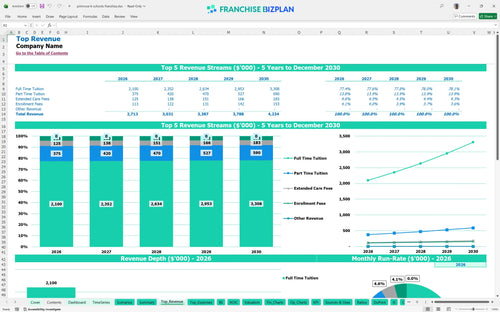
Revenue stream detailed view
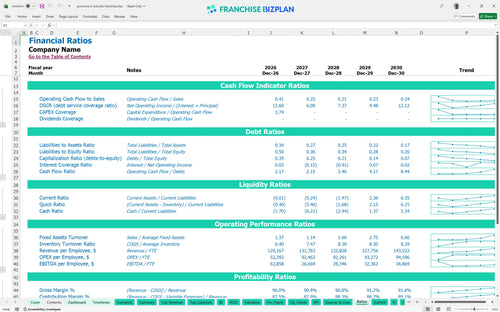
Performance metrics benchmark
We built this franchise unit financial model using our own research to ensure it reflects the high-stakes reality of the premium childcare sector. Key assumptions, such as the $1.4 million in year-one full-time tuition and the $1.34 million initial EBITDA, are pre-populated and fully editable to match your specific site. This model provides a clear roadmap for analyzing profitability for a new franchise unit with researched data on staffing, CAPEX, and royalties. Data beats guessing every single time.
The unit shows immediate EBITDA of $1.34 million in year one, though it defintely settles to $613,000 in year two as full operating costs and staffing levels normalize. By year five, EBITDA grows to $1.08 million as enrollment scales and you reach higher tuition volumes. Profitability isn't just about revenue; it's about what you keep.
You will need significant capital to launch, with a total initial investment exceeding $3.6 million when accounting for the $2.2 million in leaseholds and $550,000 for playgrounds. The model accounts for the $80,000 franchise fee and $350,000 in classroom furniture to ensure you are fully funded before doors open. You need to know where every dollar goes before you sign the lease.
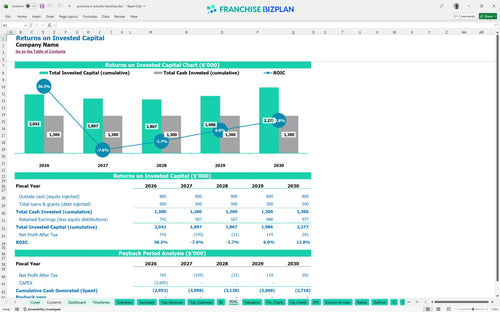
The model projects an Internal Rate of Return (IRR) of 67% and a Return on Equity (ROE) of 1.22, which are strong indicators for the sector. However, due to the massive $2.2 million build-out cost, the full payback period extends beyond the first five years of operation. Patience is a requirement when your build-out costs millions.
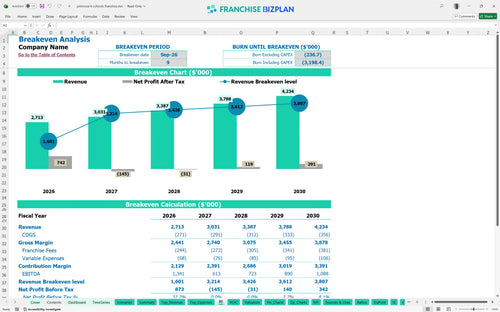
The unit is projected to hit its monthly break-even point in September 2026, approximately nine months after the initial capital outlay begins. The primary driver for reaching this milestone is the volume of full-time tuition students, which must offset the $25,000 monthly rent and high teacher payroll. The break-even point is your first major milestone.
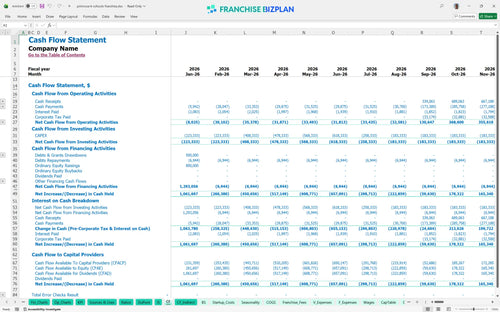
The lowest cash point occurs in September 2026, with a projected deficit of $2.01 million before the unit turns cash-flow positive. You must ensure your initial financing or cash reserves can cover this gap during the construction and early enrollment phases. Cash is oxygen, and you'll need a big tank for this climb.
In a High scenario, faster enrollment allows you to hit the $4.23 million revenue target earlier, significantly improving your IRR and shortening the payback period. Conversely, a Low scenario with slow occupancy could push the $2.01 million cash trough even deeper, requiring more working capital. Planning for the worst helps you achieve the best.
Finance: update unit break-even and payback model by Friday.
This preschool franchise financial model is built entirely in Excel, giving you total control over every variable. You can adjust the pre-filled formulas and editable assumptions to match your specific territory, whether you are looking at a single unit or a small chain. It serves as a comprehensive childcare center franchise investment feasibility study that adapts to your local market reality. This tool is your financial GPS for navigating the complex world of early childhood education business plans.

Plan for the long haul with detailed 5-year projections that track your growth from an initial $2.71 million in year one to over $4.23 million by year five. The model provides a clear view of revenue, costs, and cash flow, making it an essential preschool franchise business plan financial projections tool. It helps you visualize the transition from a startup phase to a mature, high-performing asset. Long-term planning turns a risky venture into a predictable asset.

This model specifically tracks your obligations to the franchisor, including the $80,000 initial fee and ongoing costs. It calculates the 7% royalty and 2% marketing fund contributions automatically based on your tuition revenue. Understanding these 'off-the-top' expenses is critical for a realistic franchise profitability analysis tool. Royalties are the price of brand power, so make sure the math works for you.

Estimate your total initial investment, including the $2.2 million for leasehold improvements and $550,000 for playground equipment. The model includes a built-in tool for determining break-even point for a new childcare center, showing you exactly when your monthly tuition covers your fixed rent and labor. Knowing your break-even date is the difference between sleeping at night and constant stress.

We included industry-standard benchmarks for labor and occupancy to help you sanity-check your daycare business financial projection. For instance, the model compares your $25,000 monthly rent and teacher salaries against typical ranges for high-end early childhood education centers. This ensures your financial model for high-end early childhood education centers remains grounded in reality. Benchmarks keep your assumptions grounded in reality rather than optimism.


Simply purchase and download the financial model template, then access it instantly using Microsoft Excel or Google Sheets. No installation or technical expertise required-just open and start working.

Enter your business-specific numbers, including revenue projections, costs, and investment details. The pre-built formulas will automatically calculate financial insights, saving you time and effort.

Leverage the investor-ready format to confidently showcase your financial projections to banks, franchise representatives, or investors. Impress stakeholders with clear, data-driven insights and professional reports.

Leverage the investor-ready format to confidently present your projections to banks, franchise representatives, or investors.