
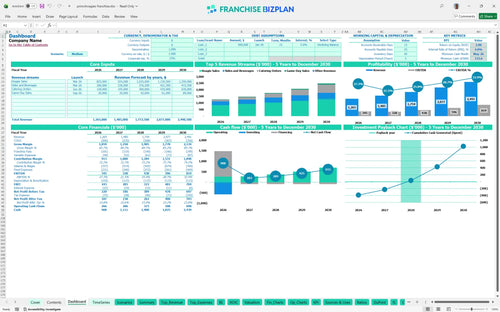
All-in-one Dashboard
Core inputs and core outputs


This comprehensive financial tool provides everything a franchisee needs to project cash flow, calculate ROI, and secure financing for a new sandwich shop location.
Core inputs and core outputs
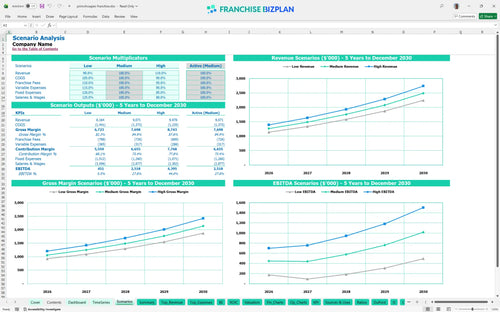
Three scenario analysis
Presentation ready
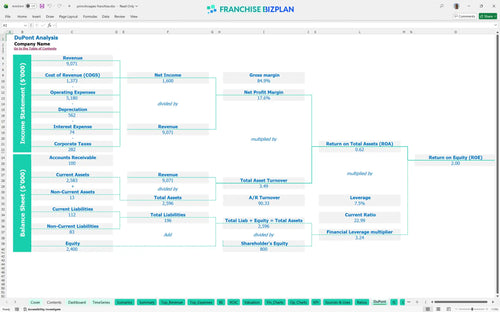
DuPont analysis
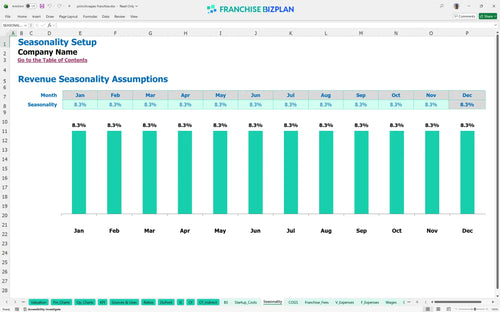
Researched revenue assumptions
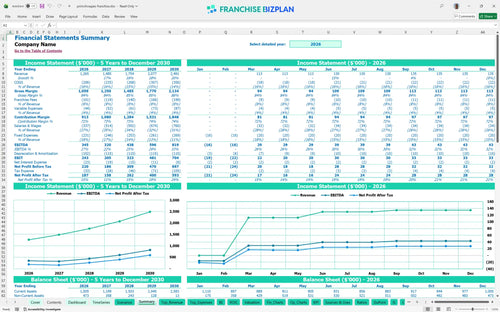
Lender-friendly financial outputs
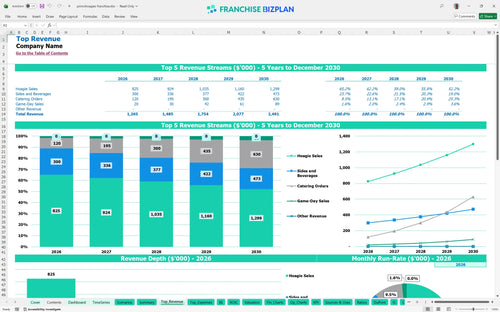
Revenue stream detailed view
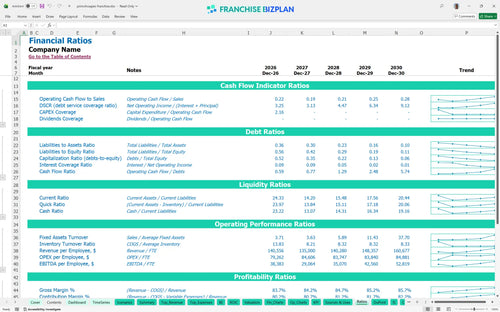
Performance metrics benchmark
We built this franchise unit financial model using our own research into the premium sandwich sector. Key assumptions, including the $1,265,000 year-one revenue target and 6% royalty fees, are pre-populated with data specific to this hoagie concept and are fully editable to match your local market.
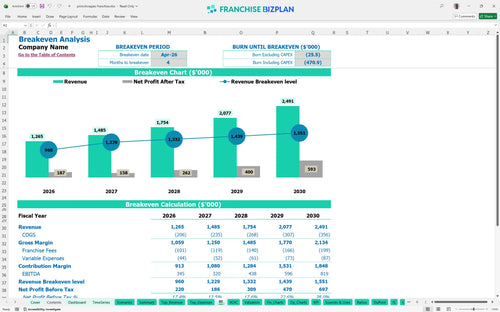
This unit is projected to reach profitability in April 2026, just four months after opening. By year five, annual EBITDA should reach $819,000 as you scale high-margin catering and game-day sales.
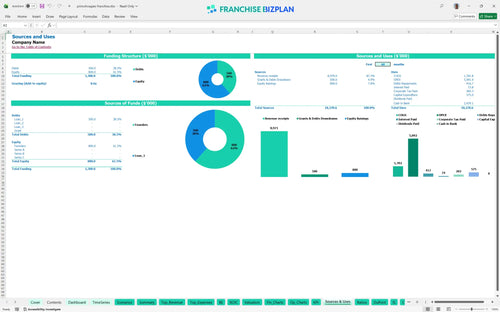
You need approximately $575,000 in upfront capital for physical assets, plus a cash buffer for the ramp-up period. This covers the $20,000 franchise fee, extensive leasehold improvements, and high-end kitchen equipment needed for the 'speed and precision' service model.
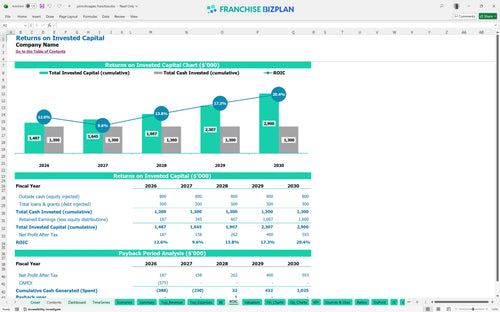
The model projects an internal rate of return (IRR) of 4.77% with a full capital payback achieved within 3 years. With a return on equity (ROE) of 2, the unit offers a stable cash flow profile once the initial debt and startup costs are cleared.
The monthly break-even point occurs in month four, driven largely by the high-volume hoagie sales and the $14,000 monthly rent for a prime location. Maintaining an efficient average ticket is the most critical lever for staying above the break-even line.
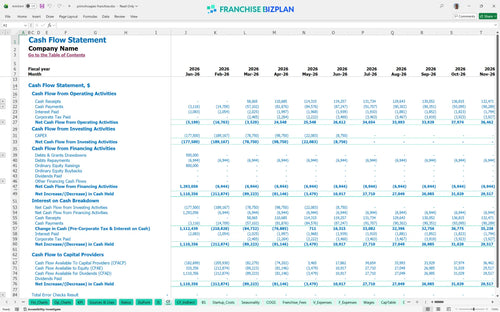
The lowest cash point is $724,000 in May 2026, so you must have adequate working capital to survive the initial opening months. This model helps you identify exactly when cash is tightest so you can manage your runway effectively.
Comparing low, medium, and high scenarios shows how a 10% shift in volume impacts your ability to cover the 2% marketing fee. Reaching the high-performance case defintely requires mastering the corporate catering channel, which is projected to grow to $420,000 by year five.
Finance: update unit break-even and payback model by Friday
This franchise financial model is a flexible Excel tool that lets you adjust every variable to fit your specific territory. It comes with pre-filled formulas and editable assumptions for revenue, labor, and overhead, making it easy to simulate different business scenarios.

Plan for long-term growth with a detailed five-year outlook that tracks revenue, expenses, and cash flow for a single unit or a small chain. This projection helps you see the transition from the initial ramp-up phase to a mature, high-volume operation.

This model accurately accounts for your ongoing brand obligations, including the 6% royalty and 2% marketing fund contributions. By baking these costs into your unit economics, you get a realistic view of your actual store-level margin after all fees.

Estimate your total initial investment and determine exactly when your sandwich shop will start turning a profit. The model breaks down fixed and variable costs to show the daily sales volume required to cover your $14,000 monthly rent and other overhead.

Compare your projected performance against standard fast-casual benchmarks to ensure your plan is realistic. Use these built-in metrics to sanity-check your food costs, which should trend toward 12.5% as you optimize operations and reduce waste.


Simply purchase and download the financial model template, then access it instantly using Microsoft Excel or Google Sheets. No installation or technical expertise required-just open and start working.

Enter your business-specific numbers, including revenue projections, costs, and investment details. The pre-built formulas will automatically calculate financial insights, saving you time and effort.

Leverage the investor-ready format to confidently showcase your financial projections to banks, franchise representatives, or investors. Impress stakeholders with clear, data-driven insights and professional reports.

Leverage the investor-ready format to confidently present your projections to banks, franchise representatives, or investors.