
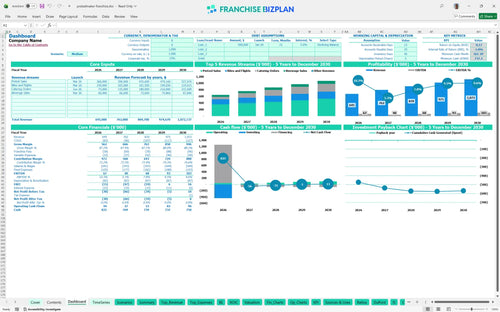
All-in-one Dashboard
Core inputs and core outputs


This retail franchise financial model for small business owners provides a complete toolkit including a 5-year pro forma, startup cost calculator, and detailed cash flow projections to evaluate investment readiness.
Core inputs and core outputs
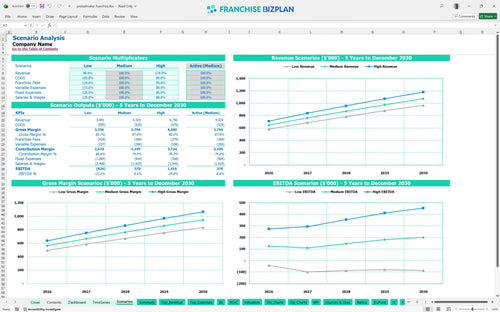
Three scenario analysis
Presentation ready
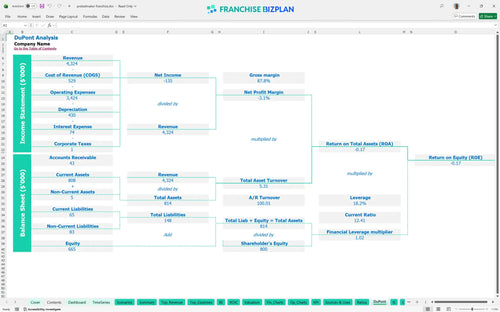
DuPont analysis
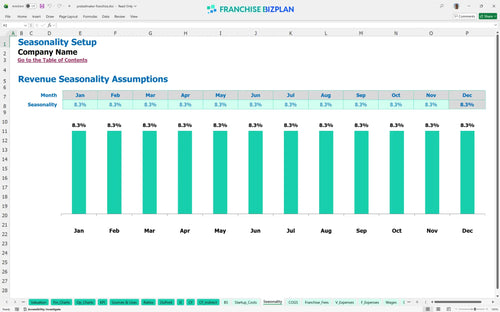
Researched revenue assumptions
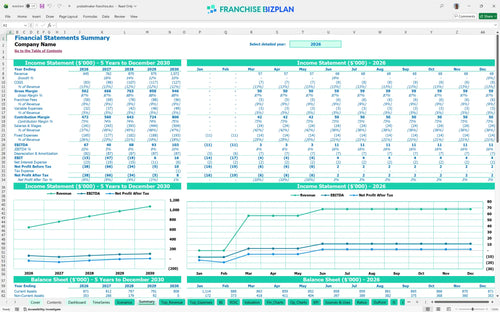
Lender-friendly financial outputs
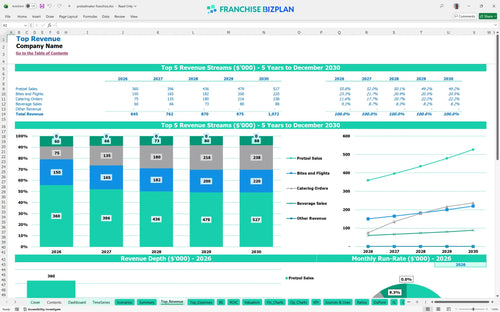
Revenue stream detailed view
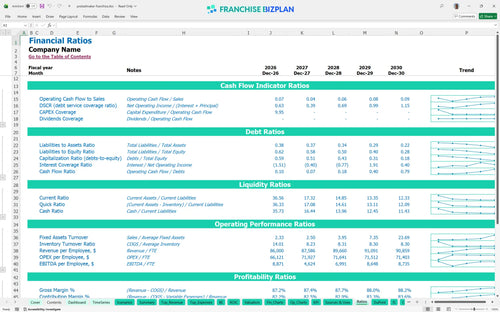
Performance metrics benchmark
We built this franchise unit financial model using our own research to reflect the specific unit economics of a premium snack location. Key assumptions like the $25,000 franchise fee, 7% royalty, and $645,000 year-one revenue are pre-populated and fully editable to match your specific territory. It's a practical way to see how a 4-month break-even timeline holds up against your local labor market.
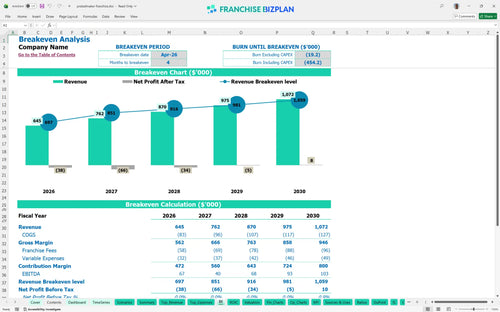
This unit hits its stride quickly, reaching operational break-even by April 2026. While year-one EBITDA starts at $67,000, the model shows profit growing to $103,000 by year five as catering orders and 'Bites and Flights' sales scale up.
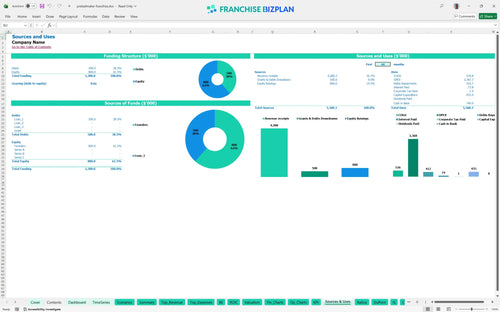
You will need approximately $435,000 to get the doors open, covering everything from the $25,000 initial fee to the $200,000 leasehold improvements. The model also accounts for $100,000 in specialized baking equipment to ensure your 'theater of baking' is ready for day one.
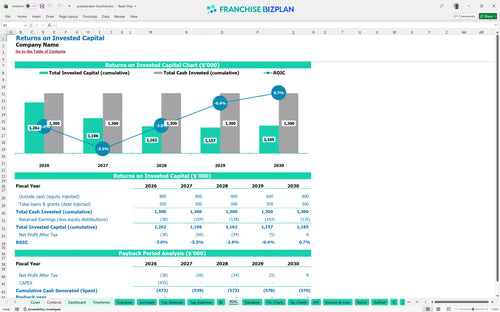
The investment shows a long-term play with a payback period extending past year five and a modest IRR of -0.98% based on these specific growth assumptions. While the cash flow is steady, the high initial build-out costs mean you are playing for the long-term equity of the location rather than a quick flip.
Monthly break-even happens in month four, provided you hit your early traffic targets at the lifestyle center. The biggest driver here is your $9,000 fixed rent; if you don't hit the projected $240,000 in annual pretzel sales, that occupancy cost becomes a heavy anchor.
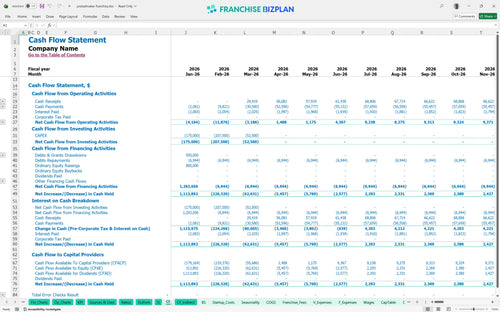
Your lowest cash point is projected for October 2029 at $737,000, assuming you started with sufficient capital to cover the $435,000 entry. You defintely need a cash buffer to handle the year-two dip where EBITDA drops to $40,000 due to planned staffing increases.
Moving from a medium to a high-revenue scenario significantly shortens the payback period and boosts year-one margins. If catering grows faster than the projected $50,000, your ability to cover the 9% combined royalty and marketing fee improves, drastically changing the peak cash need.
Finance: update unit break-even and payback model by Friday.
This franchise unit financial model template is a fully editable Excel tool designed to handle the specific unit economics of a high-traffic snack concept. You can swap out the $9,000 monthly rent or adjust the 7% royalty fee to see how local market shifts impact your bottom line. It defintely simplifies the 'what-if' games every operator plays before signing a lease.

Planning for five years helps you see the transition from a $645,000 year-one ramp-up to a mature $1.07M revenue stream. This model tracks how EBITDA (earnings before interest, taxes, depreciation, and amortization) fluctuates as you scale from 1.0 to 2.0 shift leaders to handle higher volume. It's about seeing the marathon, not just the sprint.

Royalties and marketing funds are the 'off-the-top' costs that can squeeze a small business if not modeled correctly. This tool calculates the 7% royalty and 2% marketing fee automatically against your projected sales, ensuring you know exactly how much goes to the brand before you pay for flour or labor. Understanding these franchise disclosure document financial data points is non-negotiable for ROI analysis.

You need to know when the bleeding stops and the winning starts. With a $200,000 build-out and $100,000 in baking equipment, your total entry cost is significant, but the model shows a break-even point calculation hitting in just four months. This section helps you visualize the sales volume needed to cover that $9,000 monthly rent and fixed utilities.

Don't guess if your 11% food cost is good-compare it. The model includes industry-standard ranges for retail snack units, helping you spot if your labor or packaging costs are drifting too high. If your frontline crew costs exceed the $26,000 annual per-FTE (full-time equivalent) benchmark, you'll see the margin erosion immediately in your food franchise profit and loss statement template.


Simply purchase and download the financial model template, then access it instantly using Microsoft Excel or Google Sheets. No installation or technical expertise required-just open and start working.

Enter your business-specific numbers, including revenue projections, costs, and investment details. The pre-built formulas will automatically calculate financial insights, saving you time and effort.

Leverage the investor-ready format to confidently showcase your financial projections to banks, franchise representatives, or investors. Impress stakeholders with clear, data-driven insights and professional reports.

Leverage the investor-ready format to confidently present your projections to banks, franchise representatives, or investors.