
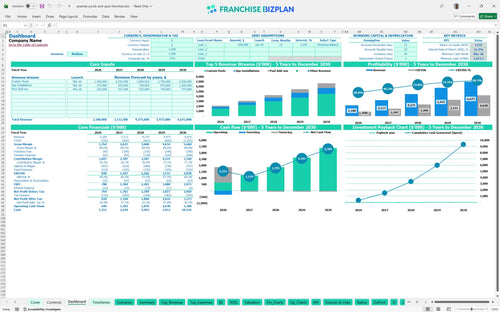
All-in-one Dashboard
Core inputs and core outputs


This comprehensive financial tool provides a pool business startup budget template and a dynamic forecasting engine designed for multi-year growth analysis.
Core inputs and core outputs
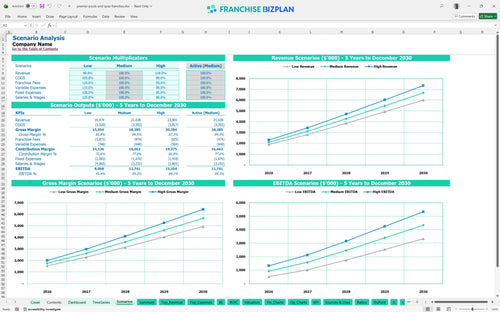
Three scenario analysis
Presentation ready
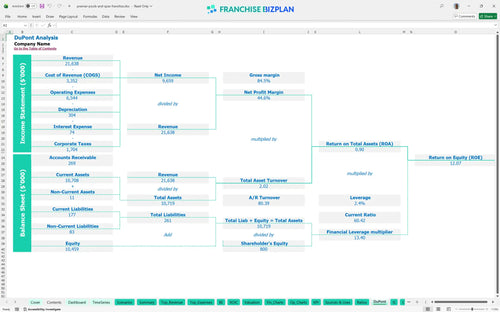
DuPont analysis
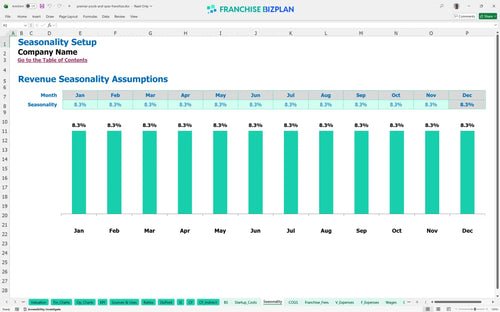
Researched revenue assumptions
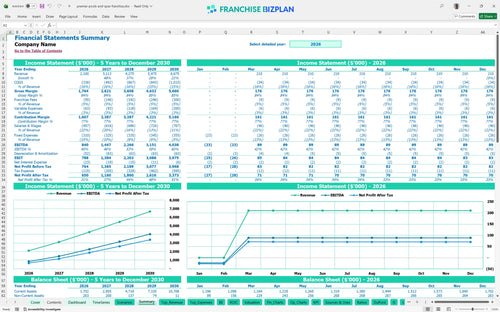
Lender-friendly financial outputs
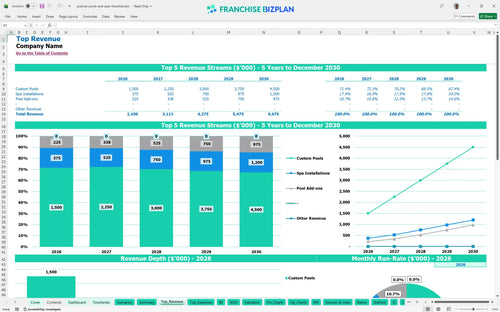
Revenue stream detailed view
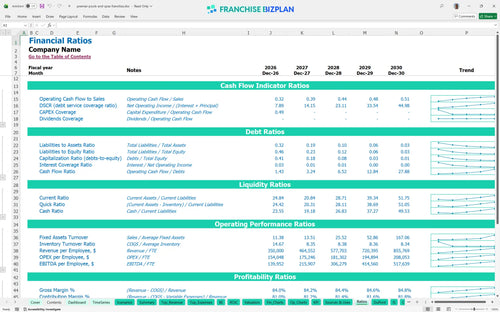
Performance metrics benchmark
We built this franchise unit financial model using detailed industry research to ensure your projections are grounded in reality. Key assumptions, such as the $2.1M year-one revenue target and the 3.5% royalty fee, are pre-populated and fully editable to match your specific market conditions.
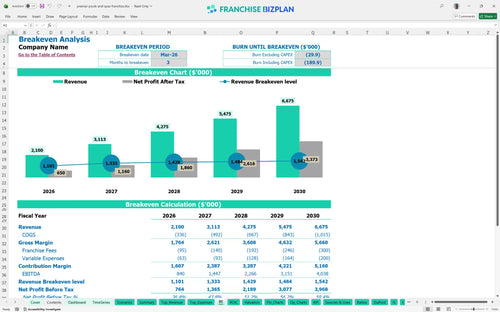
You reach profitability quickly, with the unit hitting monthly breakeven by March 2026. This franchise profitability analysis shows year-one EBITDA starting at $840,000 and climbing steadily to over $4M by the end of year five as your project volume increases.
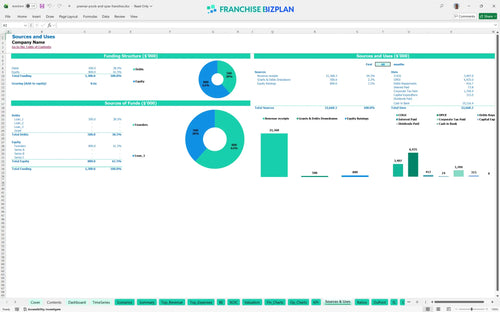
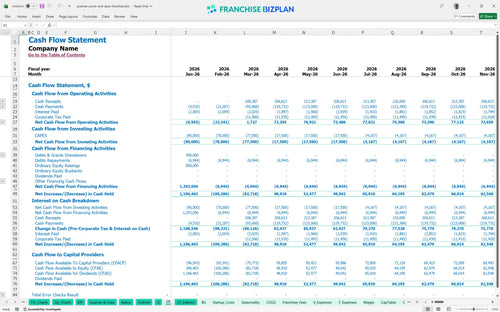
You need $315,000 for initial capital expenditure budget items plus a significant cash buffer for the ramp-up period. The lowest cash point occurs in March 2026 at $1,013,000, which represents the total liquidity you should have available to safely launch the business.
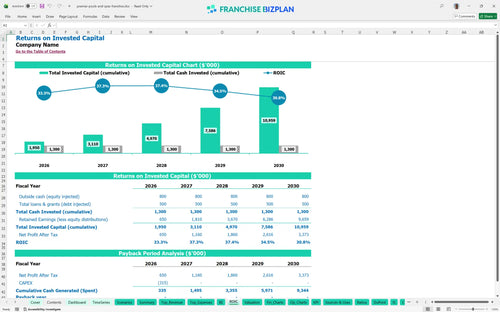
The return on investment analysis shows a strong IRR of 21.35% and a return on equity of 12.07%. While the initial heavy investment in a showroom and equipment means full payback occurs after year 5, the cash flow generation is defintely robust once the unit is mature.
You hit the monthly break-even point in March 2026, just three months after starting operations. The primary driver is your average ticket for custom pools, which must cover $15,000 in monthly rent and $475,000 in annual base salaries for your core team.
The construction business financial model template identifies March 2026 as your lowest cash point at $1,013,000. You need enough runway to cover the initial six months of fixed costs and marketing before the first major project payments clear.
Financial forecasting for pool construction business shows that a 10% drop in revenue can delay your payback, but the high-margin nature of luxury home service franchises provides a safety net. A high-case scenario driven by better sales conversion can significantly increase your year-one $840k EBITDA.
This franchise financial model is built in Excel with fully editable assumptions and pre-filled formulas, making it easy to adapt to your specific territory. You can adjust every variable in this pool construction business plan to reflect your local market costs and projected sales volume.

Long-term planning is essential, so we provide a detailed 5-year pool company financial projection that tracks your growth from launch to maturity. The model shows you how to project revenue for a pool construction franchise as you scale from $2.1M in year one to over $6.6M by year five.

This tool captures all franchise-specific financial obligations, including the 3.5% royalty and 1.0% marketing fund contributions. Tracking these franchise operating expenses against your gross sales ensures you understand the true unit economics of the brand before you sign the agreement.

Our franchise startup cost calculator maps out the $315,000 in initial capital needs, from the showroom fit-out to company vehicles. We show you how to calculate startup costs for a pool franchise while identifying the exact sales volume needed to cover your monthly fixed costs.

This spreadsheet for franchise business planning includes industry-specific benchmarks for construction materials and subcontracted labor. Using this pool builder franchise unit economic model, you can perform a business feasibility study to ensure your margins stay within the expected 10-11% range for materials.


Simply purchase and download the financial model template, then access it instantly using Microsoft Excel or Google Sheets. No installation or technical expertise required-just open and start working.

Enter your business-specific numbers, including revenue projections, costs, and investment details. The pre-built formulas will automatically calculate financial insights, saving you time and effort.

Leverage the investor-ready format to confidently showcase your financial projections to banks, franchise representatives, or investors. Impress stakeholders with clear, data-driven insights and professional reports.

Leverage the investor-ready format to confidently present your projections to banks, franchise representatives, or investors.