
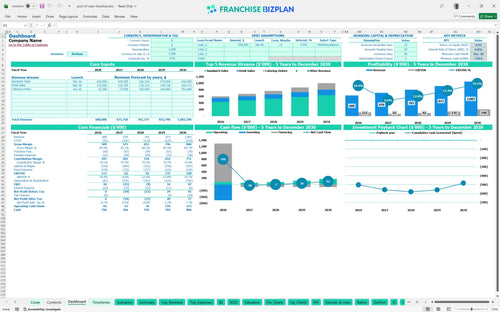
All-in-one Dashboard
Core inputs and core outputs


This financial model for fast casual sandwich franchise includes a complete Excel framework to forecast every dollar from the initial $25,000 fee to the year-five $198,000 EBITDA target.
Core inputs and core outputs
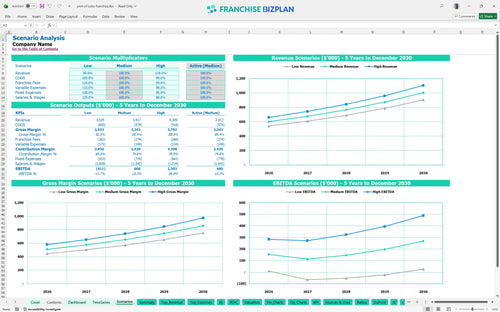
Three scenario analysis
Presentation ready
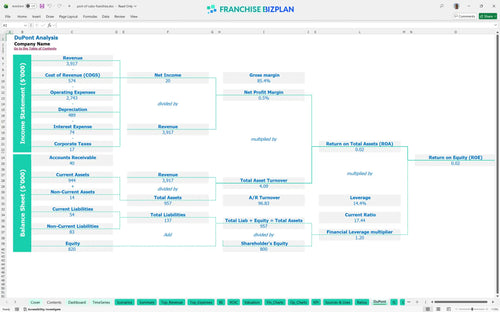
DuPont analysis
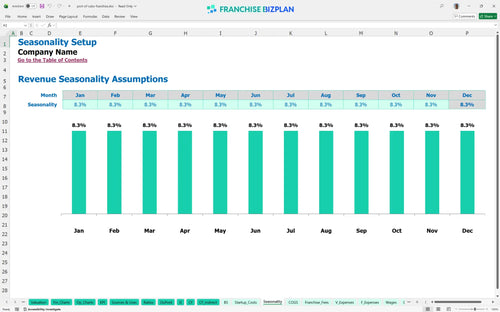
Researched revenue assumptions
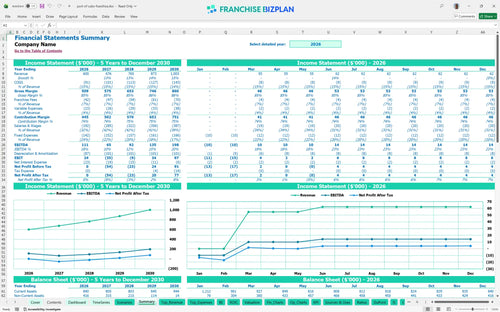
Lender-friendly financial outputs
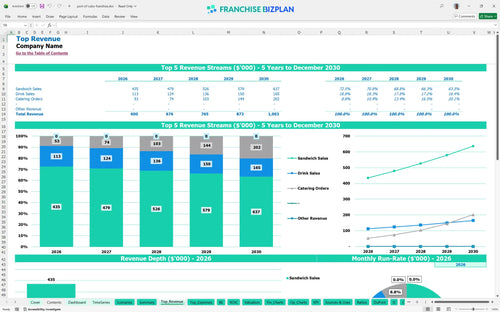
Revenue stream detailed view
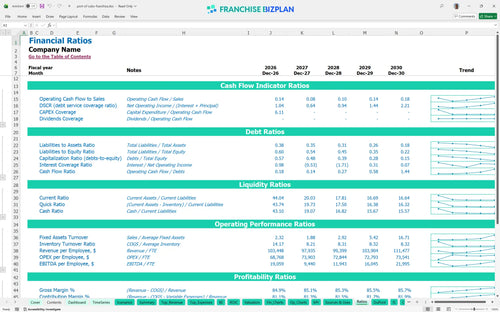
Performance metrics benchmark
We built this franchise financial model template using detailed research into the sandwich shop business plan requirements and typical unit economics. All assumptions, including the $8,500 monthly rent and 6% franchise royalty fees, are pre-populated based on the $503,000 startup costs but remain fully editable to fit your specific market. This ensures you have a reliable restaurant franchise profitability calculator excel for your own due diligence and financial forecasting for new restaurant location.
The unit reaches operational profitability in April 2026, just four months after the doors open. While year-one EBITDA is projected at $111,000, the model shows a dip in year two as you scale the assistant manager role before climbing to a $198,000 annual profit by year five. Evaluating sandwich franchise financial performance requires looking at this long-term curve rather than just the opening months. Profits grow as your catering business matures.
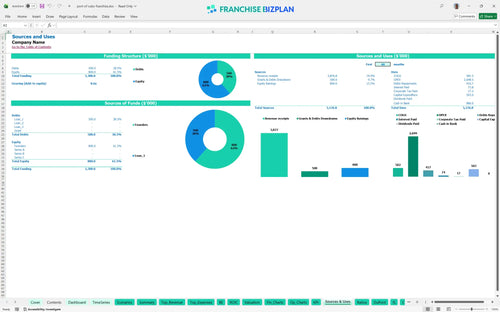
Your startup budget for quick service restaurant franchise includes $503,000 in upfront costs, with $220,000 allocated to leasehold improvements and $95,000 for kitchen equipment. You will also need to account for the $25,000 initial franchise fee and $40,000 in permits and deposits. The model suggests a minimum cash position of $759,000 to safely navigate the ramp-up period. Cash is the oxygen that keeps your build-out alive.
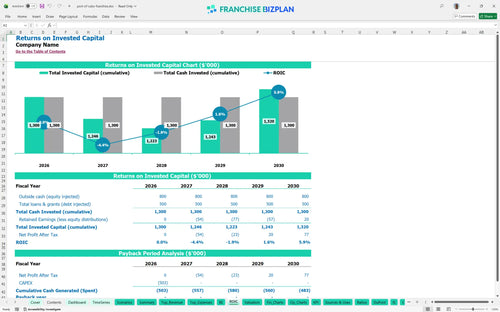
The franchise investment return on investment calculator shows an internal rate of return (IRR) of 2% over the first five years. Because of the high $503,000 initial franchise startup costs and $102,000 annual rent, the full payback of your initial equity occurs after the five-year mark. This model helps you visualize how the projected revenue for sandwich shop franchise unit translates into long-term wealth. Real wealth in franchising is often built through multi-unit expansion.
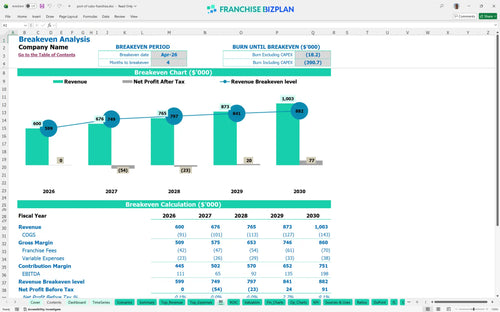
The break-even analysis for franchise units indicates you need to clear the monthly fixed costs, including $8,500 for prime location rent and over $10,000 in management salaries. You hit this point in April 2026, driven largely by the $290,000 in first-year sandwich sales. If labor costs or the restaurant food cost percentage rise unexpectedly, your break-even timeline will defintely be delayed. Watch your waste like a hawk to stay in the black.
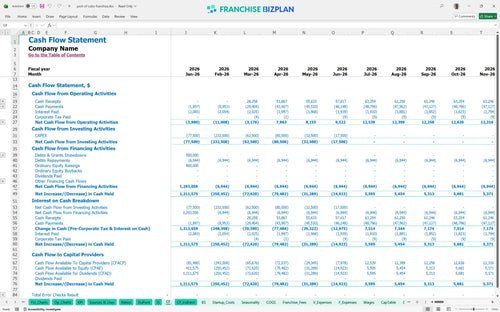
The lowest cash point occurs in December 2028, requiring you to maintain a $759,000 liquidity buffer to stay safe. This Excel template for restaurant franchise business planning highlights that even with $600,000 in year-one revenue, the timing of payroll and franchise royalty fees can squeeze your runway. You must monitor the gap between your $503,000 CAPEX and your monthly operating cash flow. Running out of cash is the only way to truly fail.
The model compares Low, Medium, and High scenarios to show how a 10% swing in sales affects your franchise investment analysis. In the High case, exceeding the $1,003,000 year-five revenue target significantly improves the 2% ROE and shortens the payback period. Conversely, the Low case demonstrates how fixed costs like the $8,500 rent can erode margins and push the peak cash need higher. Scenarios help you prepare for the worst while aiming for the best.
Finance: update unit break-even and payback model by Friday.
This Excel-based franchise financial model template lets you swap out assumptions for any market or site. You can adjust the $8,500 monthly rent or tweak the 15.1% combined food and packaging costs to see how margin shifts. It's built for operators who need to stress-test local labor rates against the 6% royalty and 1% marketing fee. Every decimal point in your food cost matters when you are slicing to order.

Planning for a single sandwich shop requires a long-view look at cash flow and debt service. This model forecasts revenue climbing from $600,000 in year one to over $1 million by year five, accounting for the ramp-up in catering and delivery. It tracks how EBITDA fluctuations impact your bottom line as you add staff, like the catering coordinator in year one. Long-term planning beats short-term guessing every time.

Franchise investment analysis must account for the off-the-top costs that never hit your pocket. This tool calculates the 6% royalty and 1% marketing fund contributions automatically based on your projected sales. By modeling these fees against a $290,000 baseline for sandwich sales, you can see exactly how much gross profit remains to cover your $102,000 annual rent. Royalties are a fixed reality of the brand's ecosystem.

Knowing how to calculate sandwich shop franchise startup costs is the difference between a successful launch and a cash crunch. With $220,000 in leasehold improvements and $95,000 in kitchen equipment, your initial outlay is significant. This model shows a break-even analysis for franchise units, identifying the exact month-April 2026-when your revenue finally covers your monthly burn. Speed to break-even is the most critical metric for a new operator.

Use this restaurant profit and loss template to compare your projected 13.5% food cost against industry standards. The model includes typical ranges for labor and occupancy, helping you spot if your $55,000 manager salary or $8,500 rent is out of line for a $600,000 volume store. It serves as a restaurant unit economics analysis guide to keep your site competitive. You should defintely compare your local reality against the franchise disclosure document (FDD) estimates.


Simply purchase and download the financial model template, then access it instantly using Microsoft Excel or Google Sheets. No installation or technical expertise required-just open and start working.

Enter your business-specific numbers, including revenue projections, costs, and investment details. The pre-built formulas will automatically calculate financial insights, saving you time and effort.

Leverage the investor-ready format to confidently showcase your financial projections to banks, franchise representatives, or investors. Impress stakeholders with clear, data-driven insights and professional reports.

Leverage the investor-ready format to confidently present your projections to banks, franchise representatives, or investors.