
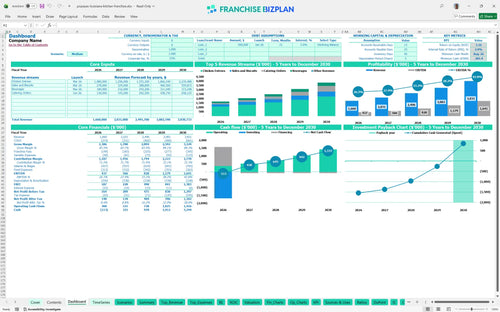
All-in-one Dashboard
Core inputs and core outputs


This franchise financial model template provides a comprehensive framework for analyzing unit economics, from initial build-out costs to long-term profitability projections.
Core inputs and core outputs
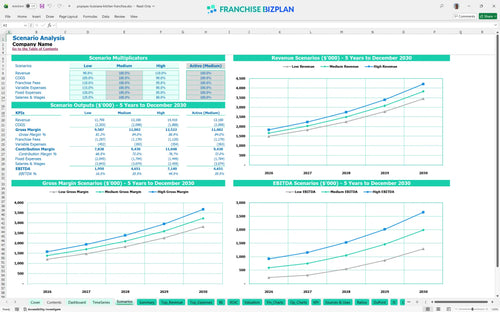
Three scenario analysis
Presentation ready
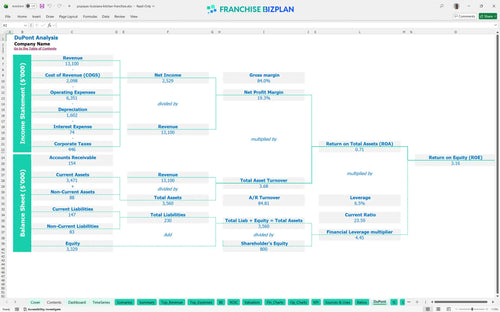
DuPont analysis
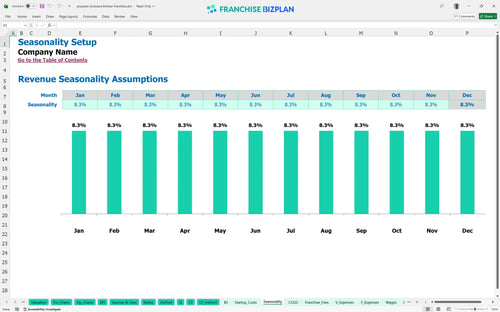
Researched revenue assumptions
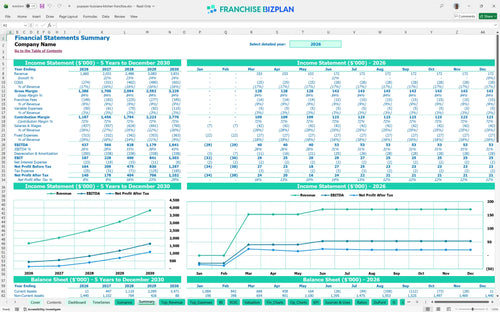
Lender-friendly financial outputs
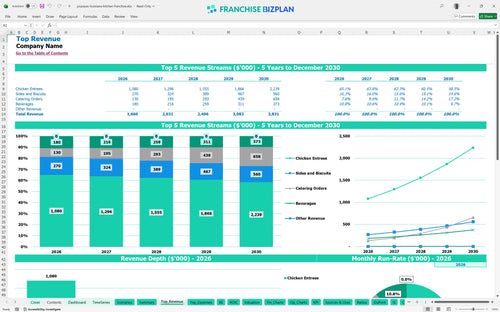
Revenue stream detailed view
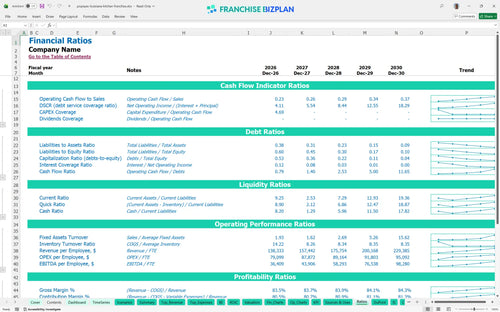
Performance metrics benchmark
We built this franchise unit financial model using our own research into high-volume quick-service chicken concepts. Key assumptions like the 14.5% food ingredient cost and the $1,690,000 initial capital expenditure budget are pre-populated with researched data specific to this Louisiana-style kitchen franchise unit and are fully editable. This financial model for fried chicken restaurant franchise helps you visualize how $1,660,000 in year-one revenue translates to store-level cash flow.
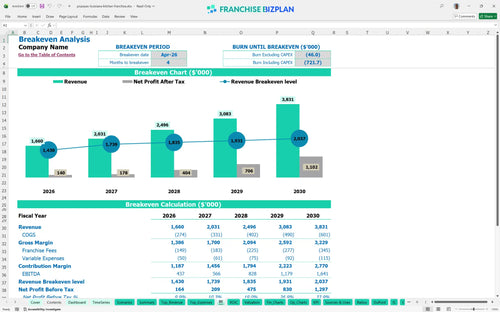
The unit hits its stride quickly, reaching the break-even date in April 2026, just four months after launch. This franchise profitability model shows EBITDA climbing from $437,000 in year one to $1,641,000 by year five as catering and 'Express Lane' traffic scale. Growth is great, but cash flow pays the rent.
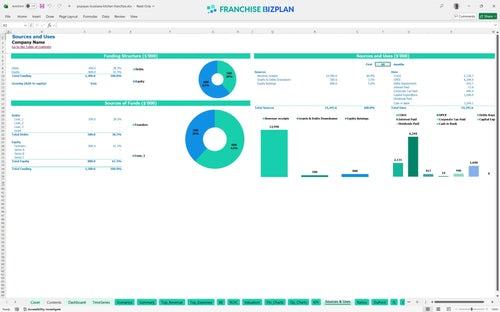
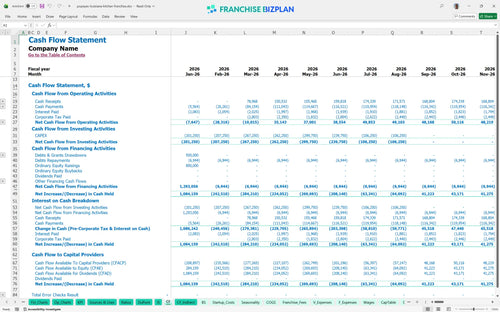
You will need roughly $1,690,000 in total initial investment to get the doors open, with leasehold improvements being the largest part of your capital expenditure budget. The model shows a minimum cash requirement of -$282,000 by August 2026, suggesting you need a solid working capital buffer to handle the ramp-up. Leaseholds are where the big money vanishes first.
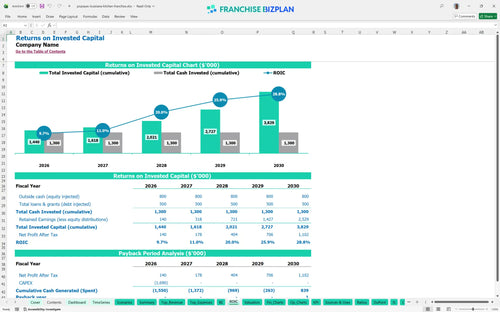
This return on investment analysis indicates a 5-year payback period with an Internal Rate of Return (IRR) of 2.88%. While the initial return on equity (ROE) is 3.16%, the real value lies in the year-5 EBITDA of $1,641,000, which significantly increases the resale value of the franchise unit. Resale value is the real prize for a multi-unit operator.
Estimating operating expenses for a new franchise location shows you need about $138,333 in monthly revenue to cover the $20,000 rent and $36,000+ in monthly management and crew wages. Analyzing franchise revenue streams and overhead costs reveals that throughput is the biggest driver; if the 'Express Lane' doesn't hit volume targets, the fixed cost burden becomes heavy. Throughput is the only lever that solves a high-rent problem.
The lowest cash point occurs in August 2026 at -$282,000, meaning your initial funding must cover more than just the build-out. Operating expense forecasting suggests that if leasehold improvements take longer than 8 months, your cash runway will shrink defintely faster than expected. Cash is oxygen; don't run out before the ramp-up ends.
Financial forecasting for quick service restaurant franchise models shows that the difference between a $1,660,000 year-1 (Medium) and a High scenario often comes down to local marketing. This franchise investment feasibility study template demonstrates that a 10% revenue drop could push the break-even date back several months and increase peak cash need. Execution beats a spreadsheet every single day.
Finance: update unit break-even and payback model by Friday.
This franchise unit financial model is fully customizable in Excel, allowing you to tweak every assumption from chicken entree prices to local labor rates. This Excel template for franchise financial forecasting uses pre-filled formulas to handle the heavy lifting so you can focus on testing different 'what-if' scenarios for your specific territory and franchise unit economics analysis. Every 1-point margin leak matters fast in a single-unit model.

Planning for a restaurant franchise business plan requires looking past the grand opening to see how scaling affects the bottom line. This model provides a detailed franchise cash flow projection and 5-year revenue forecasts, which scale from $1,660,000 in year one to $3,831,000 by year five, alongside balance sheet views. Timing gaps between opening and maturity can sink a balance sheet.

Franchise obligations are often the biggest 'hidden' drag on store-level margin if not modeled correctly. This restaurant franchise unit financial projections excel captures the 5% royalty and 4% marketing fund contributions, ensuring you see exactly how much cash stays in the unit after the franchisor takes their cut. Royalties are a top-line tax that never takes a holiday.

Launching a high-volume site involves significant upfront capital, including a $50,000 franchise fee and $850,000 in leasehold improvements. This tool simplifies how to calculate startup costs for a fast food franchise and calculating break-even point for a food franchise, helping you understand the volume needed to cover the $20,000 monthly rent. Break-even is a race against your fixed cost burn.

Don't guess on your operating margins when you can use this comprehensive franchise financial planning guide with researched benchmarks for labor and food costs. The model includes typical fast food franchise startup costs and food service profit margins, allowing you to sanity-check your $27,000 frontline crew salaries against industry standards. Benchmarks keep your assumptions grounded in reality.


Simply purchase and download the financial model template, then access it instantly using Microsoft Excel or Google Sheets. No installation or technical expertise required-just open and start working.

Enter your business-specific numbers, including revenue projections, costs, and investment details. The pre-built formulas will automatically calculate financial insights, saving you time and effort.

Leverage the investor-ready format to confidently showcase your financial projections to banks, franchise representatives, or investors. Impress stakeholders with clear, data-driven insights and professional reports.

Leverage the investor-ready format to confidently present your projections to banks, franchise representatives, or investors.