
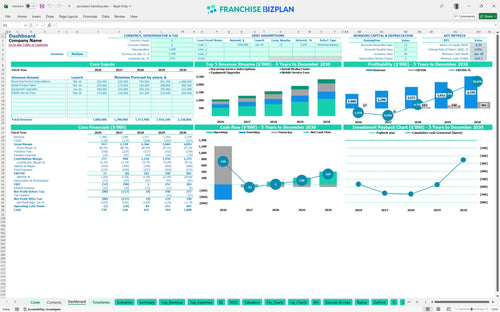
All-in-one Dashboard
Core inputs and core outputs


This franchise financial projection spreadsheet provides a complete roadmap for pool service entrepreneurs to master their unit economics and cash flow.
Core inputs and core outputs
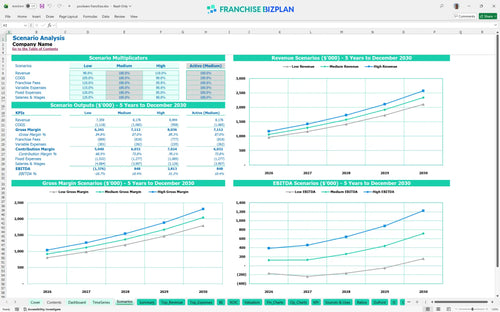
Three scenario analysis
Presentation ready
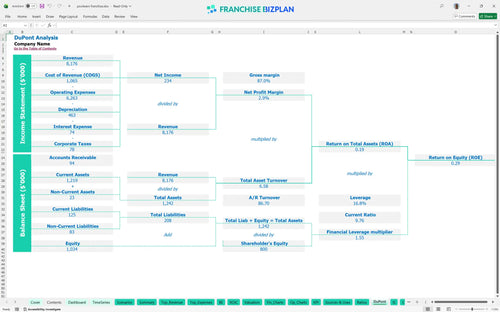
DuPont analysis
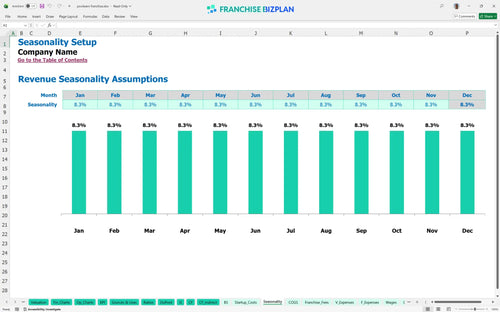
Researched revenue assumptions
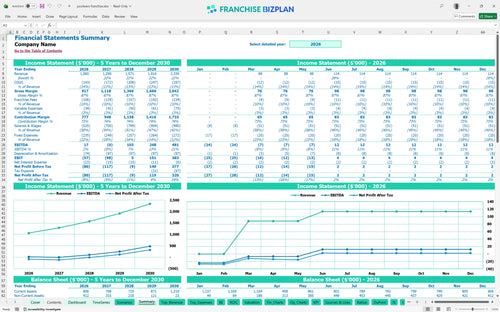
Lender-friendly financial outputs
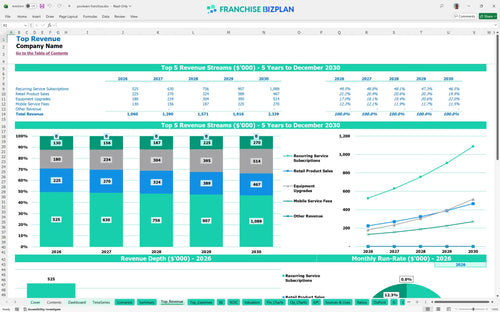
Revenue stream detailed view
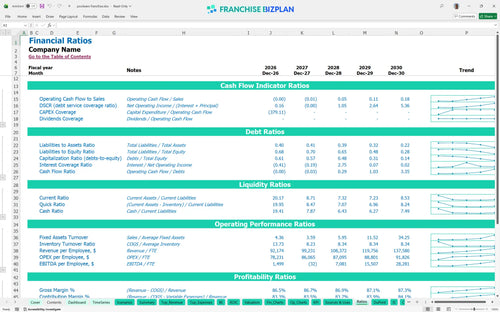
Performance metrics benchmark
We built this franchise unit financial model using extensive research into the pool service and retail sector. Key assumptions, including the $1,060,000 year-one revenue target and the 7% royalty structure, are pre-populated and fully editable to match your specific market. This financial planning guide for pool industry entrepreneurs uses real-world data to help you evaluate recurring service revenue in financial models.
You can expect the unit to reach EBITDA positivity in year one, though net profit is slim at $17,000 as you ramp up operations. By year five, EBITDA scales significantly to $481,000 as recurring service subscriptions and equipment upgrades mature. Analyzing profitability for retail and mobile service business models shows that scale is the primary driver of margin expansion.
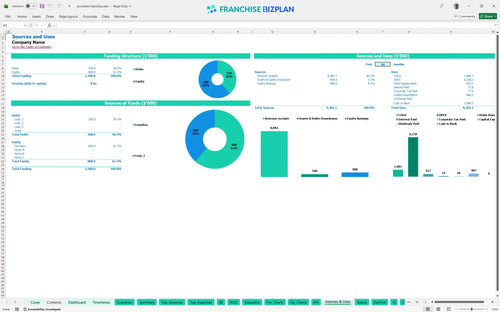
Launching this unit requires a significant initial investment, primarily driven by $185,000 in leasehold improvements and $135,000 for the mobile fleet. Total startup investment requirements for pool service franchise units exceed $485,000 when including the $49,500 franchise fee and retail fixtures. Here is the quick math: you need enough liquidity to cover these assets plus initial working capital.
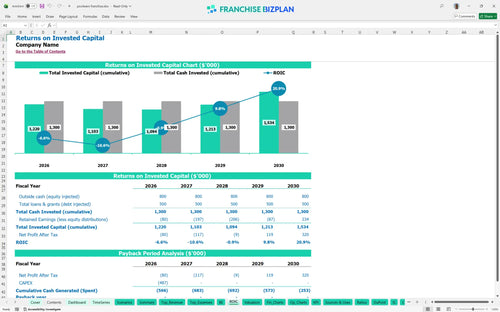
The model shows a strong internal rate of return (IRR) of 78% and a return on equity (ROE) of 29%. While the cash-on-cash payback occurs after year five due to high initial CAPEX, the long-term equity value builds fast as revenue nears $2.3M. This ROI analysis accounts for all ongoing royalties and marketing fees that impact your net take-home pay.
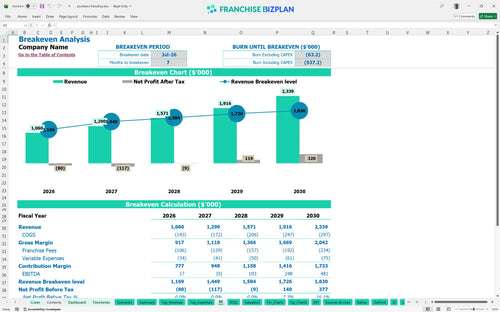
You will hit the break-even point in July 2026, roughly 7 months after starting your mobile and retail operations. This depends heavily on securing recurring service contracts quickly to cover the $14,500 monthly rent and the $15,000+ monthly management payroll. Break-even point calculation is the most critical step in creating a budget for a new franchise unit location.
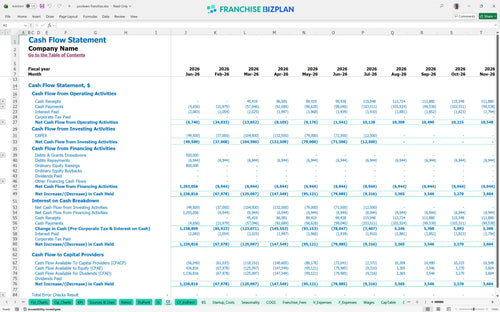
Your lowest cash point is projected at $632,000 in January 2028, reflecting the heavy investment in the fleet and showroom. This suggests you need a substantial working capital buffer to handle the timing gaps between fleet expansion and the ramp-up of new service routes. What this estimate hides is the potential for seasonal cash flow dips during winter months.
In a high-growth scenario, aggressive equipment upgrades and retail sales can push year-one EBITDA past the $17,000 baseline. Conversely, a low-growth case might delay break-even by several months if technician productivity lags or chemical costs spike above 11%. Using an Excel financial template for new franchise owners allows you to stress-test these variables before signing a lease.
This franchise unit financial model is fully customizable in Excel, allowing you to tweak every variable from service frequency to retail margins. We provide pre-filled formulas and editable assumptions so you can defintely adjust the plan for your specific territory and local labor rates. Using a franchise financial model template ensures your projections are based on the specific logic of a service-and-retail hybrid.

Map your growth from a single van to a dominant local fleet with detailed 5-year revenue, cost, and cash flow projections. This tool helps multi-unit operators see how scaling revenue from $1,060,000 in year one to $2,339,000 in year five impacts the bottom line and long-term valuation. Financial forecasting for home service franchises requires this level of depth to manage the transition from startup to mature operation.

The model tracks the 7% royalty and 3% marketing fund contributions automatically against your gross sales. By baking these franchise-specific obligations into your monthly cash flow, you get a realistic view of your store-level EBITDA after the franchisor takes their cut. This is essential for estimating revenue for mobile pool maintenance business units where margins are sensitive to top-line fees.

Use the franchise startup cost calculator to estimate your total initial investment, including the $185,000 for showroom improvements and $135,000 for the mobile fleet. The model identifies exactly when your recurring service revenue covers your $14,500 monthly rent and other fixed overhead. Knowing how to calculate startup costs for a pool service franchise prevents mid-ramp capital shortfalls.

We include pool maintenance franchise profitability benchmarks to help you sanity-check your chemical costs and labor efficiency. If your chemicals exceed the 11% target or your technician payroll is out of sync with the 5-FTE (Full-Time Equivalent) year-one plan, the model flags the variance. This pool cleaning business financial projection spreadsheet keeps your unit economics aligned with industry leaders.


Simply purchase and download the financial model template, then access it instantly using Microsoft Excel or Google Sheets. No installation or technical expertise required-just open and start working.

Enter your business-specific numbers, including revenue projections, costs, and investment details. The pre-built formulas will automatically calculate financial insights, saving you time and effort.

Leverage the investor-ready format to confidently showcase your financial projections to banks, franchise representatives, or investors. Impress stakeholders with clear, data-driven insights and professional reports.

Leverage the investor-ready format to confidently present your projections to banks, franchise representatives, or investors.