


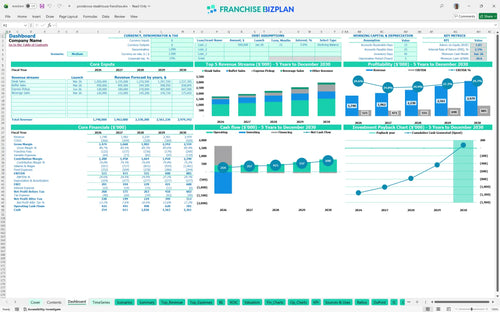
All-in-one Dashboard
Core inputs and core outputs



This franchise unit financial model template provides a comprehensive Excel-based framework for projecting revenue, expenses, and multi-year cash flows for a high-volume steakhouse and buffet operation.
Core inputs and core outputs
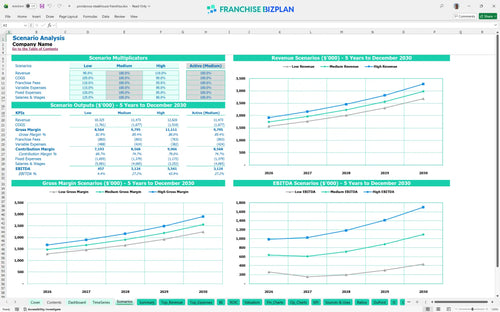
Three scenario analysis
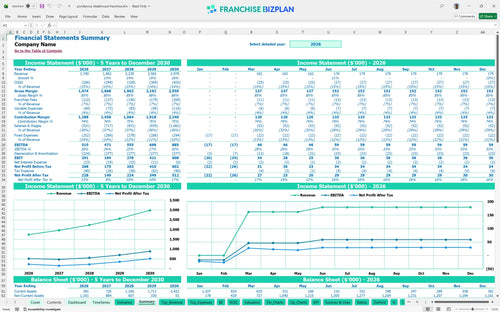
Presentation ready
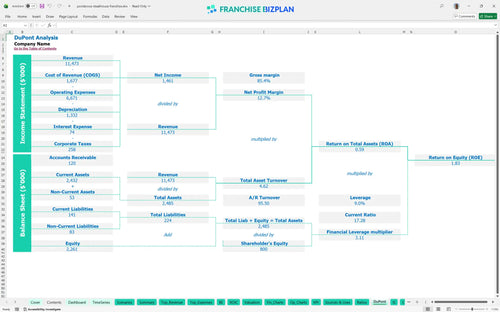
DuPont analysis
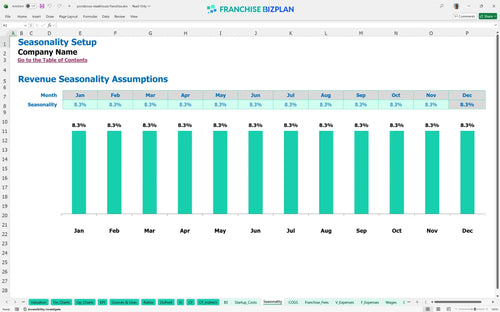
Researched revenue assumptions
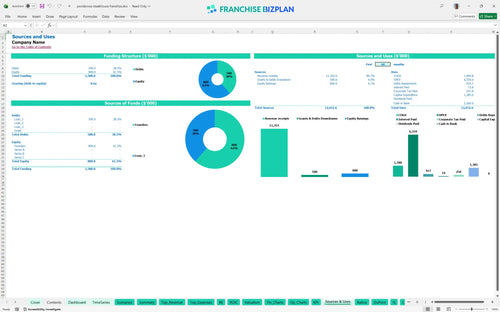
Lender-friendly financial outputs
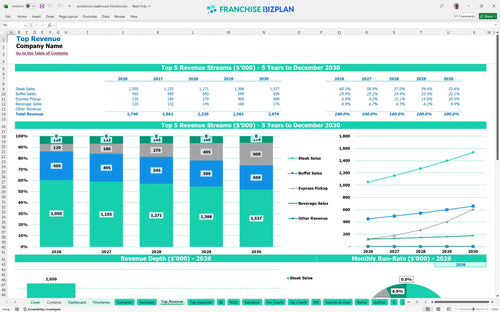
Revenue stream detailed view
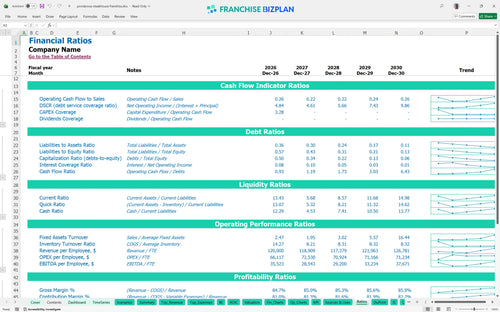
Performance metrics benchmark
We built this franchise unit financial model using our own research on high-volume dining to ensure your projections are grounded in reality. Key assumptions like the $700,000 initial steak sales and $15,000 monthly rent are pre-populated but fully editable, showing a Year 1 EBITDA of $515,000. This tool helps you navigate the complex steakhouse franchise startup costs with a data-driven roadmap for your investment.
This unit hits a $515,000 EBITDA in its first year, showing strong early profitability that scales to $885,000 by year five. You defintely need to watch the 5% royalty and 2% marketing fee as they grow with your revenue, but the model shows a healthy path when analyzing profitability for high volume buffet restaurants.
You need $1,385,000 in total capital to open this unit, with the bulk of the funds allocated to leasehold improvements and specialized kitchen gear. Knowing how to calculate startup costs for a restaurant franchise is vital, as the $650,000 build-out and $350,000 equipment package represent your largest upfront cash hurdles.
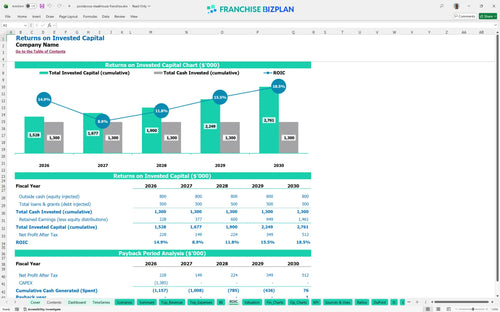
The investment offers a 2.51% IRR and a 5-year payback period based on the $1.74M starting revenue and steady growth projections. While the franchise investment ROI is conservative, the model demonstrates consistent equity building as the net margin stabilizes over the first 60 months of operation.
The unit reaches break-even in March 2026, just three months after the primary launch, provided you hit your initial traffic targets. Effective break-even analysis for restaurants shows that maintaining a $55 average ticket and managing the $15,000 monthly rent are the two biggest levers for hitting this milestone early.

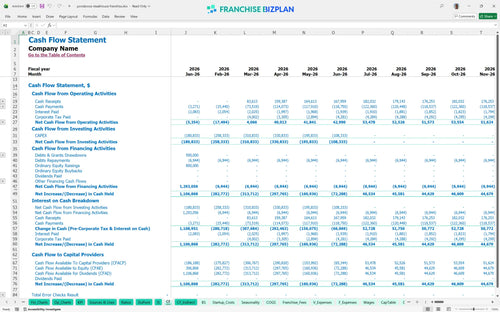
The lowest cash point is -$21,000 in June 2026, which highlights a brief period where you will need a small liquidity buffer during the ramp-up. A detailed franchise unit operational expenses breakdown shows that the timing of food ingredient payments and the $85,000 GM salary can create temporary pressure before the express pickup revenue matures.
High-performance scenarios can significantly boost the 2.51% IRR by maximizing existing table capacity and driving beverage sales toward the $175,000 year-five target. Evaluating franchise business viability with financial models allows you to see how a 10% drop in buffet volume would extend the payback period and increase the mid-2026 cash trough.
Finance: update unit break-even and payback model by Friday
This franchise financial model template is built in Excel with fully editable assumptions and pre-filled formulas, allowing you to plug in your specific territory data. You can adjust everything from local labor rates to specific rent costs, ensuring the model reflects your actual market conditions rather than just a generic estimate.

A solid restaurant franchise business plan requires long-term vision, and this model delivers 60 months of detailed revenue, cost, and cash flow tracking. It maps your growth from a Year 1 revenue of $1,740,000 to a Year 5 target of $2,979,000, helping you visualize the scaling process of a high-volume unit.

Understanding the impact of brand overhead is critical, so we included a dedicated franchise disclosure document analysis section to track ongoing obligations. The model automatically calculates the 5% royalty fee and 2% marketing fund contribution against your monthly sales, showing exactly how much cash stays in your pocket after brand fees.

Estimating steakhouse franchise startup costs is the first hurdle for any operator, and this tool breaks down the $1,385,000 total investment into clear categories. It identifies the exact sales volume needed to cover your $15,000 monthly rent and other fixed costs, providing a clear path to operational stability.

This restaurant financial projection template includes built-in benchmarks for labor and food costs to help you sanity-check your operating plan. By comparing your projected 13.5% food ingredient cost against industry standards, you can identify margin leaks before they impact your store-level EBITDA.


Simply purchase and download the financial model template, then access it instantly using Microsoft Excel or Google Sheets. No installation or technical expertise required-just open and start working.

Enter your business-specific numbers, including revenue projections, costs, and investment details. The pre-built formulas will automatically calculate financial insights, saving you time and effort.

Leverage the investor-ready format to confidently showcase your financial projections to banks, franchise representatives, or investors. Impress stakeholders with clear, data-driven insights and professional reports.

Leverage the investor-ready format to confidently present your projections to banks, franchise representatives, or investors.