
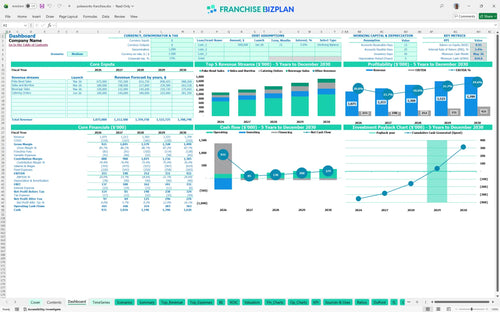
All-in-one Dashboard
Core inputs and core outputs


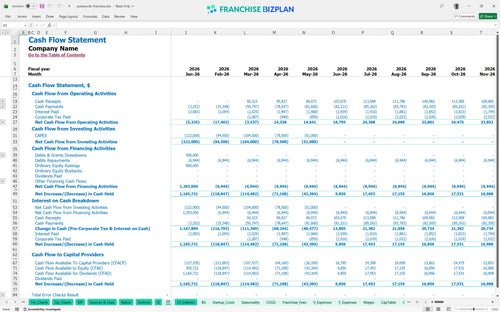
This comprehensive franchise unit financial model template includes integrated income statements, cash flow forecasts, and capital expenditure schedules to help you evaluate franchise investment opportunities with confidence.
Core inputs and core outputs
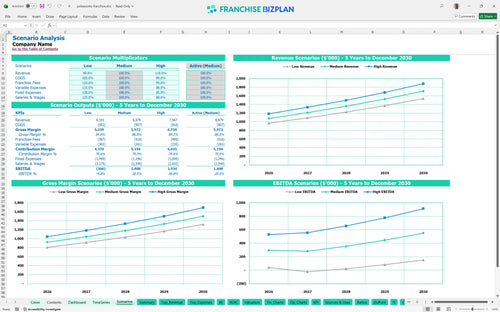
Three scenario analysis
Presentation ready
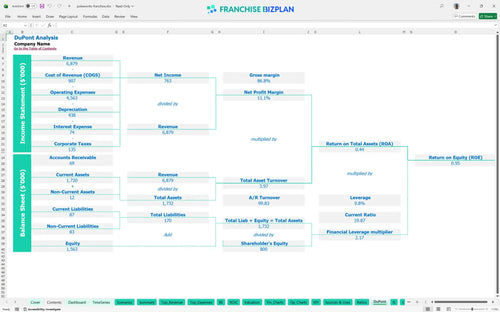
DuPont analysis
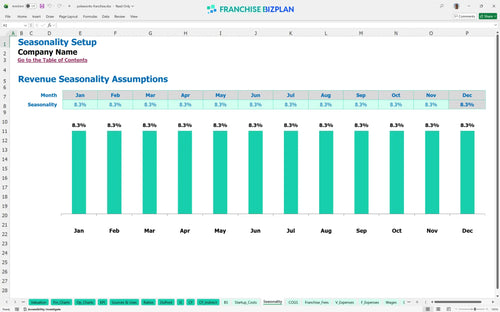
Researched revenue assumptions
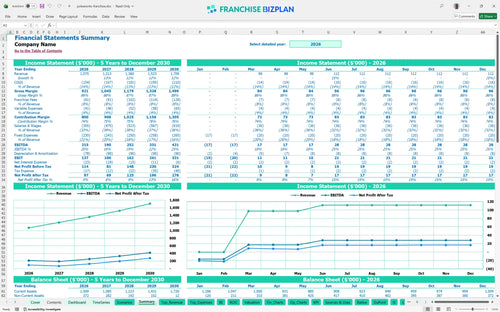
Lender-friendly financial outputs
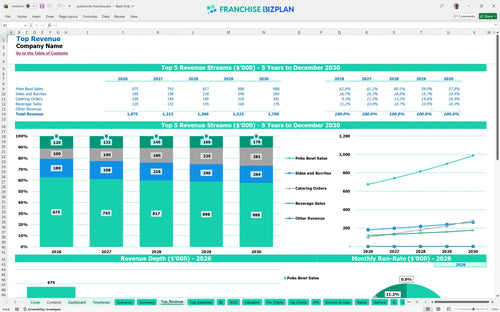
Revenue stream detailed view
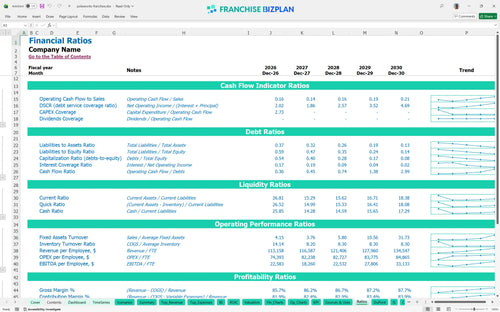
Performance metrics benchmark
We built this franchise unit financial model using our own research into the fast-casual sector. Key assumptions, including the $1,075,000 year-one revenue forecast and the 6% royalty fee, are pre-populated with researched data specific to this franchise unit and are fully editable. This tool helps you defintely understand the cash requirements and store-level EBITDA before you sign a lease or commit to a territory.
The unit is projected to reach operational profitability in April 2026, just four months after the initial startup phase. By year one, the model forecasts a positive EBITDA of $215,000, which grows to $421,000 by year five as revenue scales and food costs are optimized from 12.5% down to 10.5%.
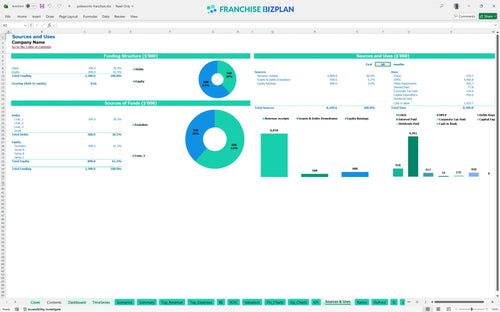
Launching this unit requires a total capital expenditure of $450,000, which includes the $40,000 franchise fee and $180,000 for leasehold improvements. This total also covers kitchen equipment, POS systems, and signage, ensuring you have a complete startup cost breakdown for food franchise planning.
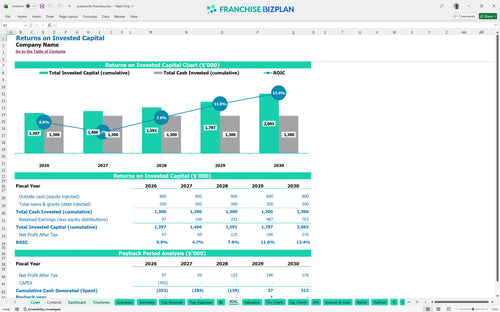
Based on the 5-year forecast, a franchisee can expect an Internal Rate of Return (IRR) of 3.45% and a Return on Equity (ROE) of 0.95. The model estimates a 4-year payback period, meaning the initial investment is fully recovered through unit cash flow by the end of the fourth year of operation.
The unit reaches its break-even point in April 2026, four months after opening. Calculating break-even point for food franchises requires balancing the $15,000 monthly rent and 7.5% combined royalty and marketing fees against daily bowl sales and catering volume.
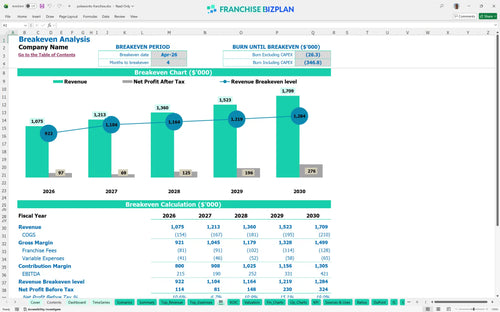
The lowest cash point is projected for May 2026 at $818,000, highlighting the importance of maintaining a liquidity buffer during the ramp-up phase. Managing the monthly operating expense budget for restaurants is critical to protecting this runway as you scale toward mature unit volumes.
The model shows revenue growing from $1.07M in year one to $1.7M in year five, which significantly improves the store-level margin. Restaurant financial forecasting for franchisees demonstrates that hitting the high-case scenario depends on maintaining high-volume catering and keeping food costs below 11%.
Finance: update unit break-even and payback model by Friday.
This franchise financial model is a fully customizable Excel tool designed for precision and flexibility. It features pre-filled formulas and editable assumptions, allowing you to tweak everything from local rent to specific labor rates to fit your territory and operating scenario. This flexibility ensures your fast casual restaurant business plan reflects local market realities rather than just generic averages.

Long-term planning is essential for any franchise investment analysis. This model provides detailed 5-year revenue, cost, cash flow, and profit projections tailored for a single unit or a small chain. By mapping out growth from year one through year five, you can visualize the impact of scaling and mature-unit performance on your overall portfolio.

The model accurately captures specific financial obligations, including the initial franchise fee and ongoing franchise royalty fees. It calculates monthly royalty payments and brand marketing fund contributions based on gross sales, so you understand the real economics of the brand before local overhead. This helps you track the total cost of staying compliant with brand standards.

Estimating restaurant startup costs is the first hurdle for any new operator. This unit economics template includes a detailed startup cost breakdown for food franchise units, helping you determine the total initial investment and the sales level required to cover fixed and variable costs. The break-even analysis identifies the exact month your unit stops burning cash and starts generating a return.

The model incorporates built-in benchmarks for key metrics like labor, occupancy, and gross margins. These allow you to sanity-check your assumptions against typical fast-casual ranges and identify potential margin leaks early. Comparing your expected performance to industry standards helps ensure your restaurant financial forecasting for franchisees remains grounded in reality.


Simply purchase and download the financial model template, then access it instantly using Microsoft Excel or Google Sheets. No installation or technical expertise required-just open and start working.

Enter your business-specific numbers, including revenue projections, costs, and investment details. The pre-built formulas will automatically calculate financial insights, saving you time and effort.

Leverage the investor-ready format to confidently showcase your financial projections to banks, franchise representatives, or investors. Impress stakeholders with clear, data-driven insights and professional reports.

Leverage the investor-ready format to confidently present your projections to banks, franchise representatives, or investors.