
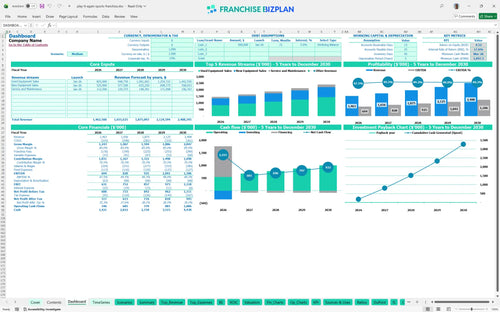
All-in-one Dashboard
Core inputs and core outputs


This template provides a complete financial engine for projecting revenue, expenses, and investment returns for a sporting goods retail unit.
Core inputs and core outputs
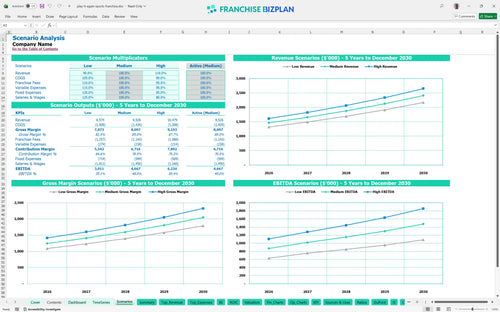
Three scenario analysis
Presentation ready
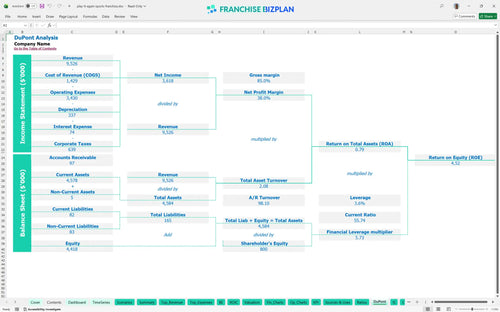
DuPont analysis
Researched revenue assumptions
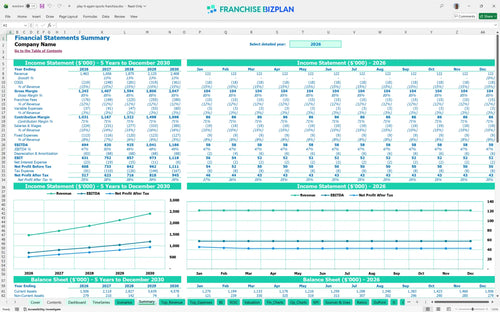
Lender-friendly financial outputs
Revenue stream detailed view
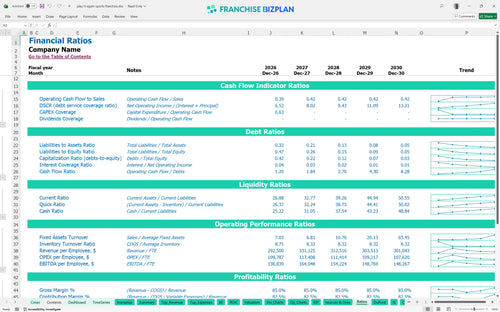
Performance metrics benchmark
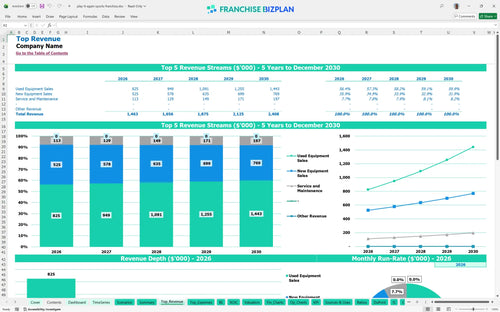
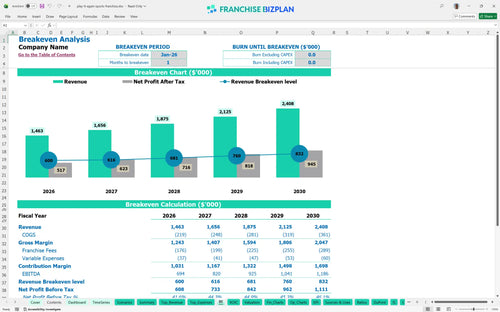
Your unit hits the break-even point in January 2026, just one month after launch. With year-one EBITDA projected at $694,000, the model shows a strong trajectory as used equipment sales scale to $961,953 by year five.
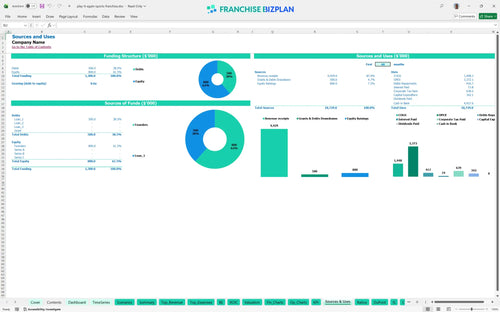
You need $342,050 to get the doors open, covering everything from the $25,000 franchise fee to leasehold improvements. This budget ensures your retail franchise unit economics spreadsheet accounts for the $60,000 needed for fixtures and $30,000 for service equipment.
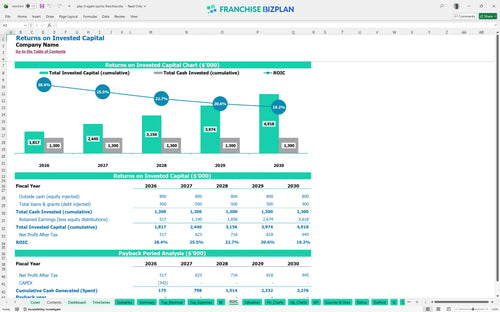
The model projects an Internal Rate of Return (IRR) of 17.57% and a Return on Equity (ROE) of 4.52. While the cash flow is strong, the total payback period extends after year five due to the significant initial leasehold and inventory investment.
To cover your $9,400 in monthly fixed costs, including $7,500 for rent, you must maintain steady throughput in used gear sales. The break-even occurs in month one because the model assumes immediate inventory turnover and service demand.
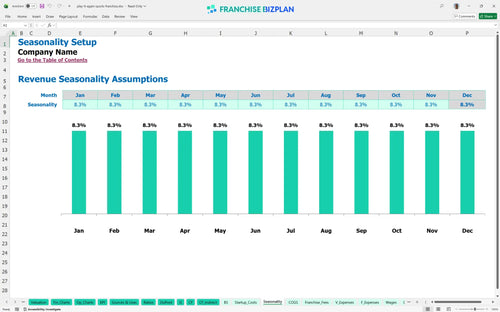
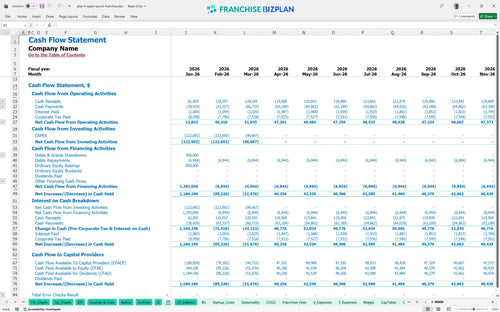
Your lowest cash point hits in March 2026 at $1,047,000, suggesting you have a massive buffer if you start with the recommended capital. This runway allows you to handle the seasonal dips common in a used sports equipment store business model.
The high-case scenario assumes revenue climbs from $1.46M to $2.4M by year five. If revenue drops 10% in a low-case scenario, your 12% combined royalty and marketing fee remains fixed, putting immediate pressure on your $60,000 GM salary budget.
Review the five-year EBITDA projections to ensure the $1.18M year-five target aligns with your multi-unit expansion goals. One-liner: Success in retail is found in the margins of the used inventory. Finance: update unit break-even and payback model by Friday.
This sports franchise financial model is a fully customizable Excel tool designed for precision. You can adjust every assumption from inventory mix to labor hours, and the pre-filled formulas handle the heavy lifting. It's defintely built to adapt to your specific territory and local market density. One-liner: You control the inputs, the model handles the math.

Plan your multi-unit expansion or single-store growth with a retail franchise business plan that spans 60 months. This model tracks revenue scaling from $1.46M in year one to over $2.4M by year five. It provides a clear view of how your balance sheet evolves as you reinvest in inventory and equipment. One-liner: Long-term visibility prevents short-term cash surprises.

Franchise-specific costs can eat your margin if you don't track them closely. This tool calculates the 5% royalty and 7% marketing fund contributions automatically based on your gross sales. It ensures your franchise investment breakdown accounts for every dollar owed to the franchisor before you calculate your take-home pay. One-liner: Know your true cost of brand membership.

Launching a new location requires significant capital, and this franchise startup costs template maps out the $342,050 initial requirement. You can see exactly how leasehold improvements and initial inventory impact your day-one cash position. It also identifies the exact sales volume needed to cover your $7,500 monthly rent and other fixed costs. One-liner: Accurate startup budgets lead to faster break-even dates.

Stop guessing if your labor or rent costs are too high. The model uses unit economics data to help you compare your $9,400 monthly fixed overhead against industry standards. It helps you sanity-check your used equipment margins and service revenue targets to ensure your store-level EBITDA stays competitive. One-liner: Benchmarks turn raw data into actionable management goals.


Simply purchase and download the financial model template, then access it instantly using Microsoft Excel or Google Sheets. No installation or technical expertise required-just open and start working.

Enter your business-specific numbers, including revenue projections, costs, and investment details. The pre-built formulas will automatically calculate financial insights, saving you time and effort.

Leverage the investor-ready format to confidently showcase your financial projections to banks, franchise representatives, or investors. Impress stakeholders with clear, data-driven insights and professional reports.

Leverage the investor-ready format to confidently present your projections to banks, franchise representatives, or investors.