
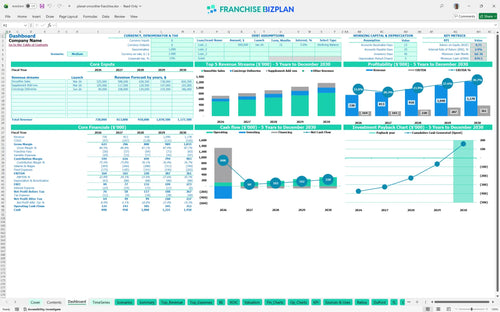
All-in-one Dashboard
Core inputs and core outputs


This model provides a complete roadmap for your investment, covering everything from initial build-out to five-year cash flow projections.
Core inputs and core outputs
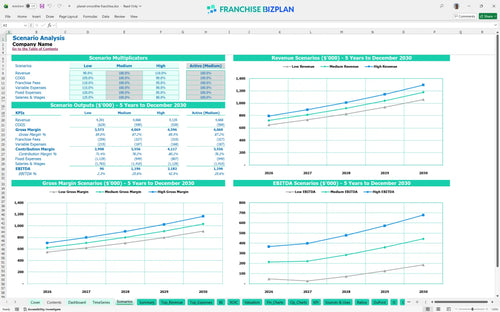
Three scenario analysis
Presentation ready
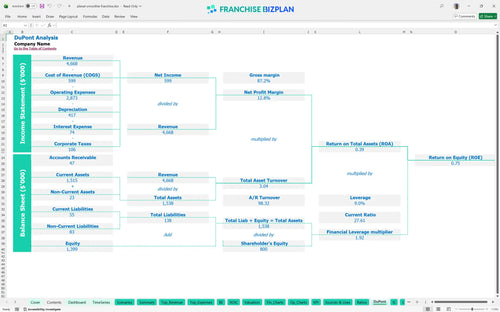
DuPont analysis
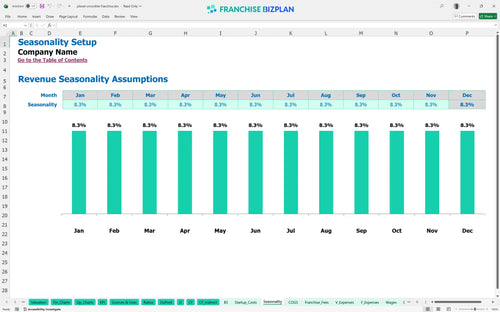
Researched revenue assumptions
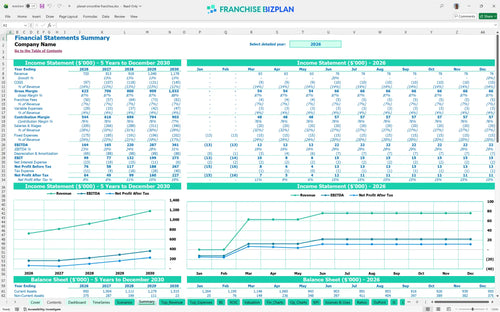
Lender-friendly financial outputs
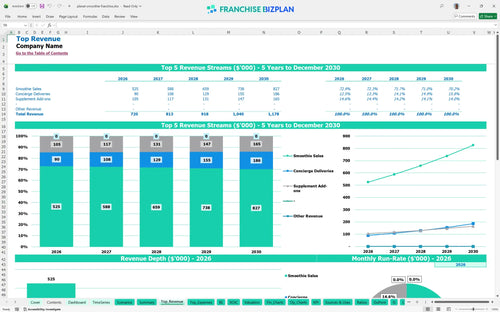
Revenue stream detailed view
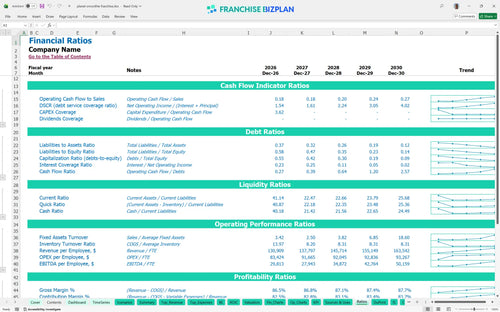
Performance metrics benchmark
We built this franchise unit financial model using intensive research into the smoothie and health-food sector. Key assumptions like the $720,000 year-one revenue and 5% royalty fees are pre-populated and fully editable to match your specific location. This tool gives you a data-driven starting point to evaluate the feasibility of your retail investment.
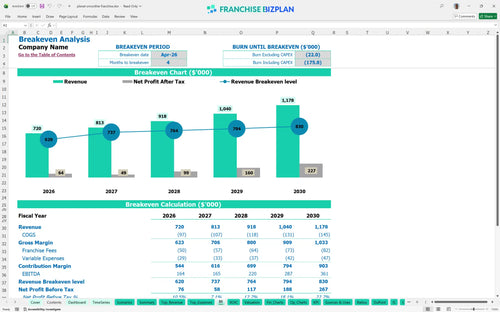
Based on the data, this unit hits its stride quickly, reaching break-even by April 2026, just four months after launching. While year-one EBITDA starts at $164,000, the real gains happen as you scale toward $361,000 in annual EBITDA by year five. You will need to watch those 5% royalties and 2% marketing fees to keep margins healthy as you grow.
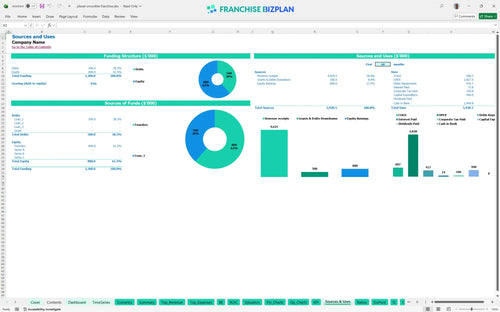
You are looking at a significant initial outlay, with leasehold improvements alone costing $210,000 and equipment at $95,000. Total CAPEX reaches $440,000 when you include the $25,000 franchise fee and digital systems. Honestly, you should plan for a minimum cash requirement of $840,000 to handle the ramp-up and maintain a safety net through the first year.
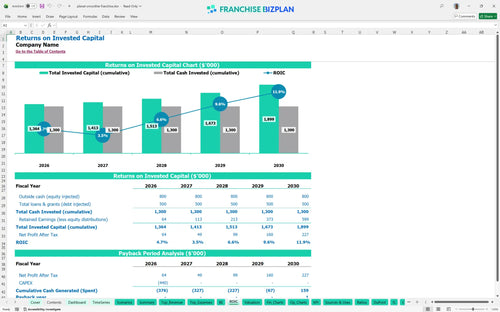
This is a long-term play with a payback period of 5 years. The internal rate of return (IRR) is 2.92%, and the return on equity (ROE) sits at 0.75. While the initial years are about capital recovery, the cash flow becomes much more attractive once you hit that $1.17M revenue mark in year five. Patience is required for this level of build-out.
Your unit needs to clear its fixed costs-led by $11,200 in monthly rent-within the first four months to stay on track for the April 2026 break-even date. The main driver here is volume; you need enough daily smoothie sales to offset the 13.5% combined cost of ingredients and packaging. If labor costs creep above the planned manager and crew salaries, that break-even date will defintely slide.
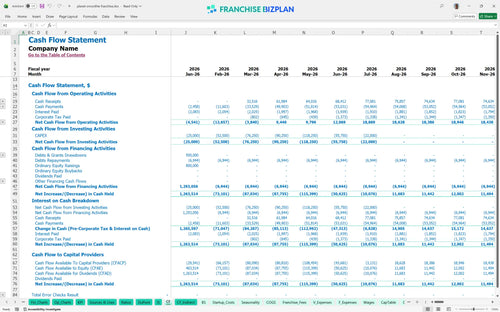
The model shows your lowest cash point occurs in July 2026, with a minimum cash balance of $840,000. This means you need a solid capital buffer to survive the first six months of operations after the heavy build-out spend. If your opening takes 90+ days longer than planned, the pressure on your working capital will rise significantly.
Moving from a medium to a high-revenue scenario significantly changes your year-one EBITDA of $164,000. In a high-growth case, your ability to leverage fixed costs like the $11,200 rent means more profit drops to the bottom line. Conversely, a low scenario where revenue misses the $720,000 year-one target could push your 5-year payback out even further. Still, the model helps you prepare for any of these three paths.
Finance: update unit break-even and payback model by Friday.
This franchise unit financial model template is built in Excel to let you swap out assumptions as fast as your local market changes. You can tweak the pre-filled formulas for labor, rent, and ingredient costs to see how different scenarios impact your bottom line. It is a flexible tool designed to handle everything from a single-unit startup to a small multi-unit expansion. Every line item is open, so you can adjust the math to fit your specific territory.

Planning for the long term is the only way to survive in the competitive food and beverage space. This model tracks your revenue growth from $720,000 in year one up to $1,178,000 by year five, giving you a clear view of your path to scale. It covers your full P&L, balance sheet, and cash flow so you are not surprised by tax season or equipment refreshes. Real growth requires looking past the first twelve months.

Royalties are a reality of the system, and this model bakes them in from day one. With a 5% royalty and a 2% marketing fund contribution, you need to know exactly how much cash is leaving the business before you pay your own bills. We have automated these calculations so you can see the impact of brand fees on your monthly store-level margin. It helps you understand the true cost of the brand's support and systems.

Getting the doors open is the biggest hurdle, especially with leasehold improvements hitting $210,000. This tool helps you map out the total startup investment and identifies the exact sales volume needed to cover your $11,200 monthly rent and other fixed costs. Knowing your break-even point helps you set realistic daily traffic goals for your crew. You cannot manage what you do not measure.

Do not fly blind when it comes to labor or food costs. The model includes benchmarks to help you see if your 11.2% fruit ingredient cost or your staffing plan is in line with healthy industry standards. It is a sanity check that ensures your projections are grounded in the real-world economics of running a high-volume retail shop. Comparing your numbers to the average keeps your expectations realistic.


Simply purchase and download the financial model template, then access it instantly using Microsoft Excel or Google Sheets. No installation or technical expertise required-just open and start working.

Enter your business-specific numbers, including revenue projections, costs, and investment details. The pre-built formulas will automatically calculate financial insights, saving you time and effort.

Leverage the investor-ready format to confidently showcase your financial projections to banks, franchise representatives, or investors. Impress stakeholders with clear, data-driven insights and professional reports.

Leverage the investor-ready format to confidently present your projections to banks, franchise representatives, or investors.