
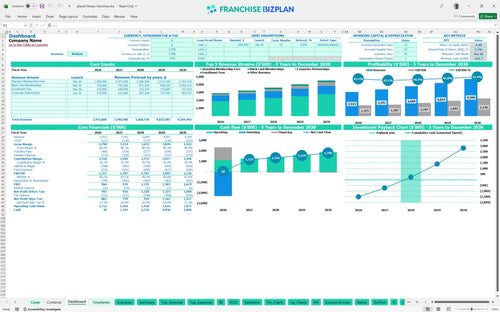
All-in-one Dashboard
Core inputs and core outputs


This comprehensive financial model for opening a new gym location provides a turn-key solution for projecting membership revenue, labor costs, and long-term ROI.
Core inputs and core outputs
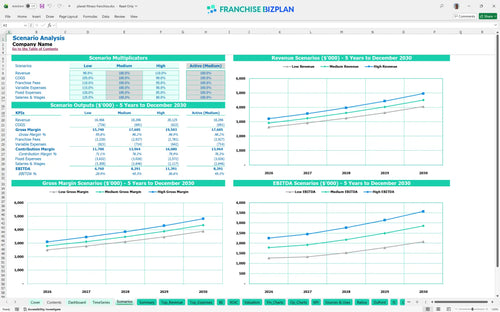
Three scenario analysis
Presentation ready
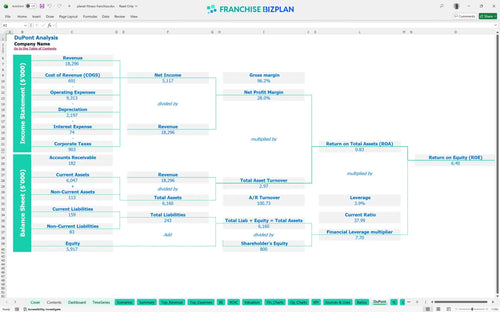
DuPont analysis
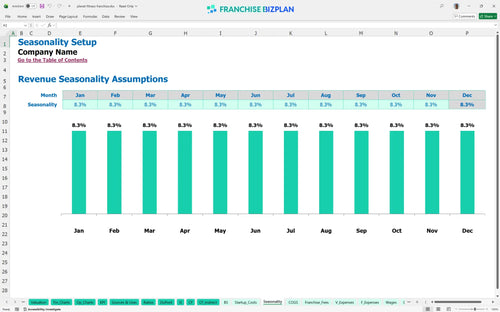
Researched revenue assumptions
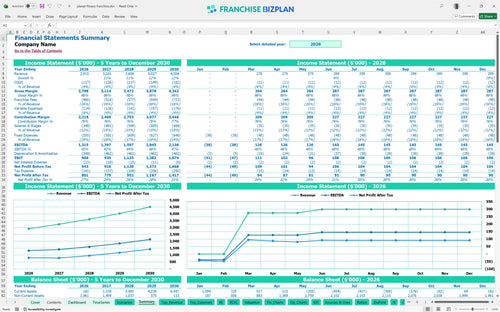
Lender-friendly financial outputs
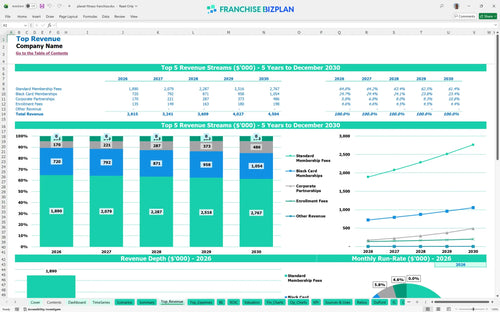
Revenue stream detailed view
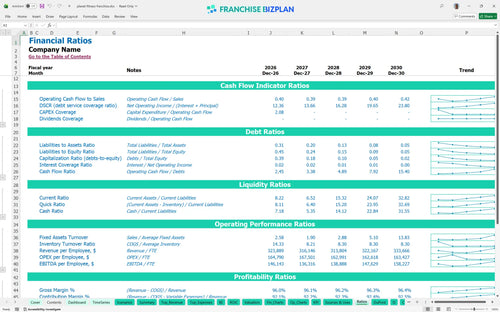
Performance metrics benchmark
We developed this fitness franchise unit economic assessment using detailed research into high-volume gym operations. The model comes pre-populated with data for membership tiers, $2.31 million in capital expenditures, and a 16% combined royalty and marketing fee, all of which you can edit to fit your local market conditions. This ensures your gym business feasibility study is grounded in the actual costs of running a 20,000-square-foot facility.
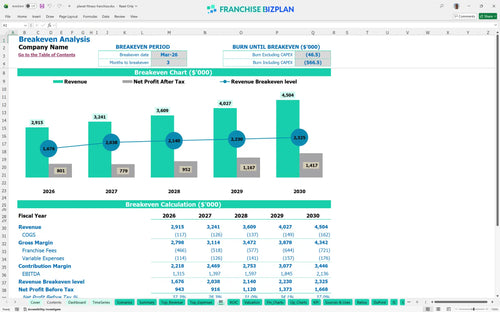
The franchise unit is projected to reach its break-even point in March 2026, just three months after launch. With year-one EBITDA estimated at $1.31 million, the model shows a rapid transition from startup losses to positive operating income as membership density increases.
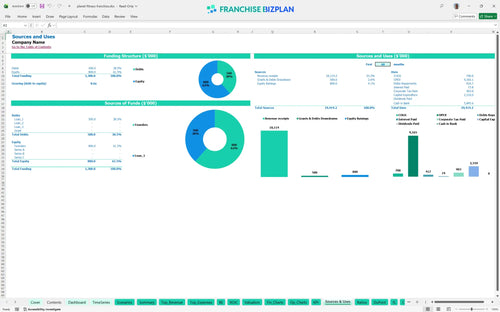
You need approximately $2.31 million to launch this unit, covering everything from the initial franchise fee to heavy equipment. The largest outlays include $850,000 for leasehold improvements and a combined $800,000 for cardio and strength training machines to fill the anchor space.
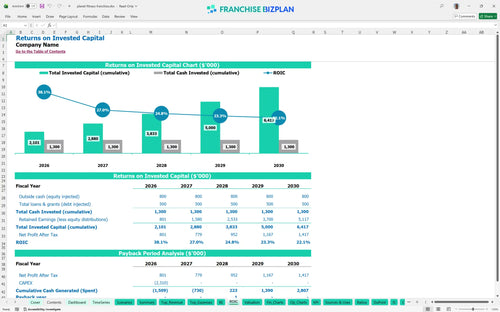
Investors can expect an Internal Rate of Return (IRR) of 5.06% and a Return on Equity (ROE) of 6.4% over the five-year hold period. The model projects a full payback of the initial investment within three years, assuming revenue scales from $2.9 million to $4.5 million as planned.
To cover fixed costs like the $32,000 monthly rent and $11,000 in monthly utilities and insurance, the unit must hit its break-even volume by month three. The primary driver for this is membership volume, as the 16% royalty and marketing burden requires high throughput to maintain margins.
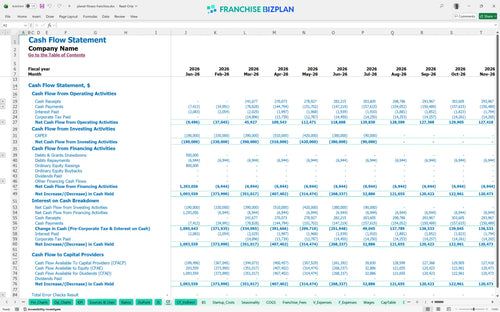
The lowest cash point occurs in June 2026, with a projected deficit of $622,000 during the initial ramp-up phase. You will need a significant working capital buffer to handle the timing gap between the $2.3 million build-out and the accumulation of recurring monthly membership dues.
Switching between scenarios shows that a 10% drop in membership retention defintely delays payback by over 12 months. High-performance scenarios, driven by corporate partnerships and Black Card Spa upgrades, can push year-five EBITDA toward $2.1 million, significantly improving the overall IRR.
Finance: update unit break-even and payback model by Friday.
This fitness franchise financial model is built entirely in Excel, allowing you to adjust every variable from membership growth to utility costs. You can modify pre-filled formulas and editable assumptions to match your specific territory, whether you are looking at a high-traffic urban center or a suburban retail hub. It provides a flexible framework to test different operating scenarios before you sign a lease.

Plan your long-term growth with a gym franchise investment analysis that spans 60 months of detailed performance data. The model tracks revenue scaling from $2.91 million in year one to over $4.5 million by year five, helping you visualize the path from opening day to a mature, multi-unit operation. You get a clear view of how membership compounding impacts your bottom line over time.

Operating a major gym brand involves specific financial obligations that can squeeze margins if not tracked. This template for gym franchise financial forecasting automatically calculates the 7% royalty fee and 9% marketing fund contribution based on your monthly gross sales. It ensures you account for every dollar owed to the franchisor so your store-level EBITDA remains accurate and realistic.

Getting your doors open requires significant capital, and this tool helps you map out the $2.31 million in gym franchise startup costs. From the $20,000 initial fee to the $850,000 leasehold improvements, you can see exactly where your money goes. The model identifies the specific sales volume needed to cover your $32,000 monthly rent and other fixed overheads.

We integrated real-world data into this fitness center business plan to help you sanity-check your numbers. The model includes benchmarks for cleaning supplies at 2.8% of sales and payment processing at 2.9%, ensuring your variable costs align with industry standards. Use these markers to identify margin leaks in your staffing or utility spend before they impact your cash flow.


Simply purchase and download the financial model template, then access it instantly using Microsoft Excel or Google Sheets. No installation or technical expertise required-just open and start working.

Enter your business-specific numbers, including revenue projections, costs, and investment details. The pre-built formulas will automatically calculate financial insights, saving you time and effort.

Leverage the investor-ready format to confidently showcase your financial projections to banks, franchise representatives, or investors. Impress stakeholders with clear, data-driven insights and professional reports.

Leverage the investor-ready format to confidently present your projections to banks, franchise representatives, or investors.