
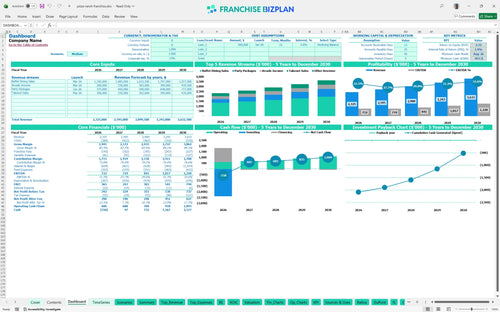
All-in-one Dashboard
Core inputs and core outputs


This franchise unit financial model template provides a complete toolkit for analyzing startup costs, 5-year P&L projections, and unit-level cash flow for a buffet and entertainment concept.
Core inputs and core outputs
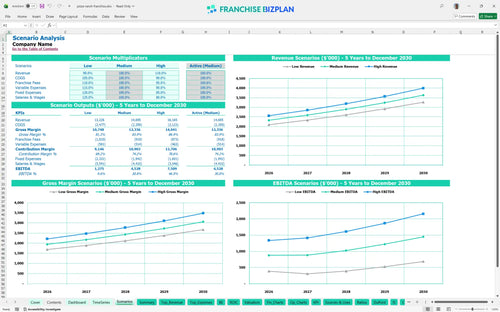
Three scenario analysis
Presentation ready
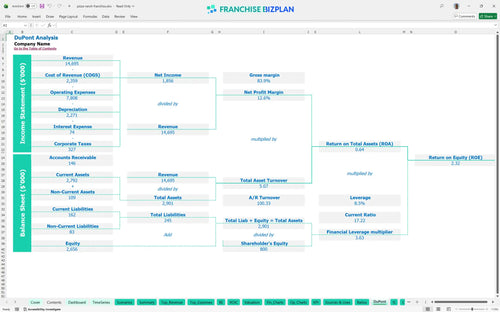
DuPont analysis
Researched revenue assumptions
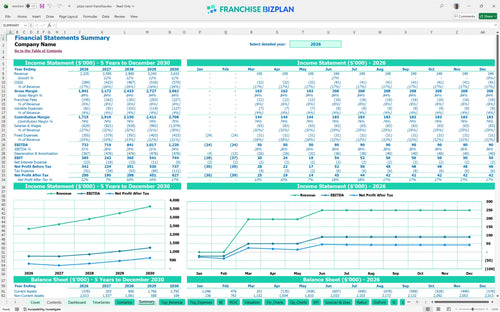
Lender-friendly financial outputs
Revenue stream detailed view
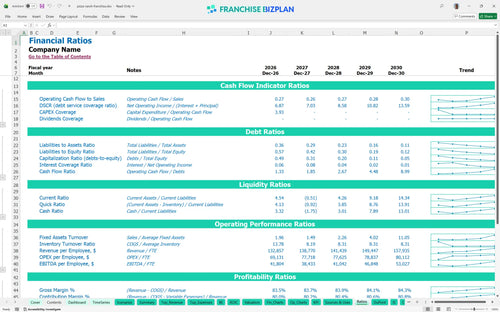
Performance metrics benchmark
We built this buffet restaurant financial projection using our own research into the family entertainment center business model to ensure every line item is grounded in reality. Key assumptions for revenue streams like arcade income, party packages, and buffet sales-along with expenses like the 4% royalty and $18,000 monthly rent-are pre-populated and fully editable. With a Year 1 EBITDA projected at $732,000, this model helps you track if your unit is hitting the legendary performance standards expected in this segment.
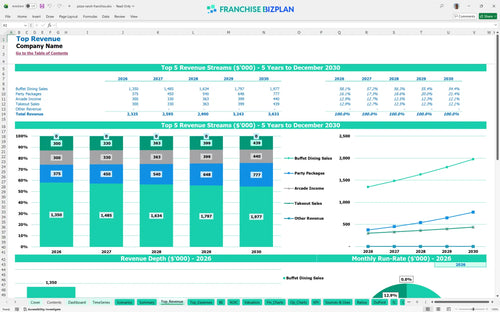
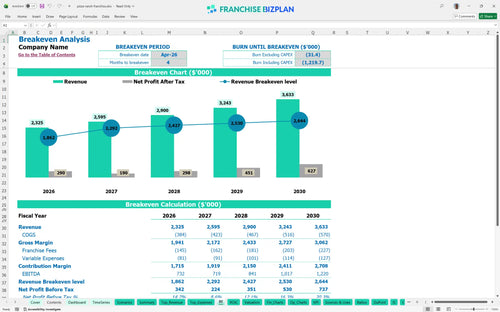
The unit is projected to be profitable from the start, generating $732,000 in EBITDA during the first year on $2,325,000 in total sales. By Year 5, revenue is expected to climb to $3,633,000 as you mature the party package and arcade income streams. Profit isn't just what's left over; it's what you plan for.
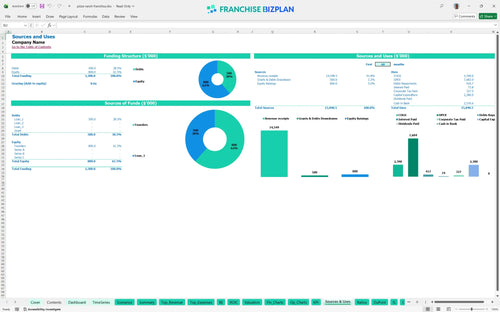
Launching this unit requires a total capital investment of $2,380,000, which covers everything from the $30,000 franchise fee to the $650,000 arcade equipment. This franchise investment analysis spreadsheet shows that leasehold improvements represent the largest spend at $900,000, followed by kitchen and buffet station setups. Cash out is easy; cash in takes work.
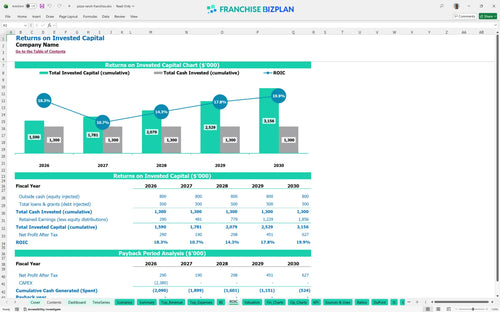
Based on the current projections, you can expect an Internal Rate of Return (IRR) of 1.94% and a Return on Equity (ROE) of 2.32%. While the model shows the payback period extends beyond the initial 5-year window, the steady climb in EBITDA to $1,220,000 by Year 5 suggests strong long-term equity building. ROI is the only metric that truly tells you if the risk was worth it.
The model projects a monthly break-even date in April 2026, just four months after the initial launch phase. This quick ramp-up depends heavily on hitting the $900,000 annual buffet dining sales target and maintaining tight control over the $18,000 monthly rent. Speed to break-even is the best defense against a bad market.
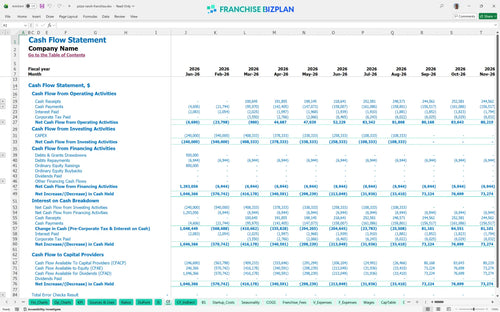
The lowest cash point occurs in August 2026, with a projected minimum cash balance of negative $858,000, indicating a need for significant working capital or financing at the start. You will defintely need a robust cash buffer to handle the gap between the heavy CAPEX spend and the ramp-up of party package revenue. Cash is oxygen, and you're holding your breath until you hit the lowest point.
The financial model for family entertainment center franchise allows you to toggle between Low, Medium, and High scenarios to see how a 10% drop in buffet traffic affects your Year 1 margin. While the High case sees revenue scaling to $3.6M by Year 5, the Low case highlights the risk of fixed costs like insurance and property taxes eating into your cash runway. Hope is not a strategy, but a high-case scenario is a goal.
Finance: update unit break-even and payback model by Friday.
This franchise financial model template is built in Excel with fully editable assumptions and pre-filled formulas, allowing you to adjust every variable for your specific territory. You can modify everything from local rent prices to specific labor rates, ensuring the projections match your local market reality rather than a generic corporate average. Control your numbers or they will control you.

Plan for the long term with detailed 5-year revenue, cost, and cash flow forecasts designed specifically for a restaurant franchise business plan. The model tracks the transition from initial launch to a mature unit, showing how margins evolve as you scale throughput and optimize food waste. Five years is a lifetime in food service, so plan for the long haul.

This franchise unit profit and loss template captures every brand-specific obligation, including the initial $30,000 franchise fee and ongoing 4% royalty payments. By automating the calculation of the 2.25% marketing fund contribution against gross sales, you get a clear view of your actual store-level margin after all corporate overhead is paid. Royalties are a top-line tax that never goes away.

Use this restaurant franchise startup cost breakdown to estimate your total initial investment, including the heavy $900,000 leasehold improvement budget and $650,000 arcade equipment spend. The model identifies the exact sales volume needed to cover your $18,000 monthly rent and other fixed obligations. Knowing your break-even is the difference between sleeping and staring at the ceiling.

This operational expenses spreadsheet includes built-in benchmarks for labor, food costs, and occupancy to help you sanity-check your buffet restaurant financial projection. If your food ingredients exceed the 14% benchmark or labor costs spike, the model flags the variance so you can adjust your staffing or portion controls. Benchmarks keep your ego in check and your margins in line.


Simply purchase and download the financial model template, then access it instantly using Microsoft Excel or Google Sheets. No installation or technical expertise required-just open and start working.

Enter your business-specific numbers, including revenue projections, costs, and investment details. The pre-built formulas will automatically calculate financial insights, saving you time and effort.

Leverage the investor-ready format to confidently showcase your financial projections to banks, franchise representatives, or investors. Impress stakeholders with clear, data-driven insights and professional reports.

Leverage the investor-ready format to confidently present your projections to banks, franchise representatives, or investors.