
All-in-one Dashboard
Core inputs and core outputs


This quick service restaurant financial model provides a complete toolkit for evaluating unit-level performance, from initial build-out to a mature five-year operation.
Core inputs and core outputs
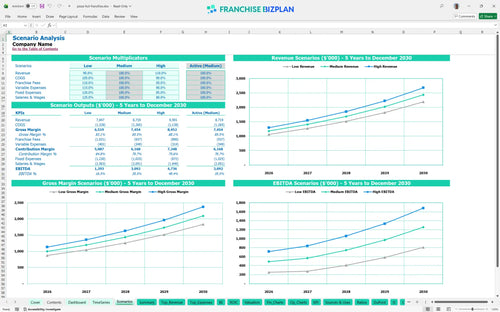
Three scenario analysis
Presentation ready
DuPont analysis
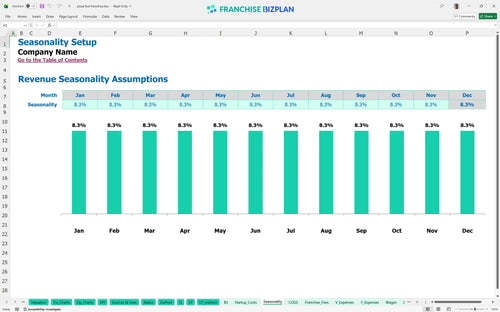
Researched revenue assumptions
Lender-friendly financial outputs
Revenue stream detailed view
Performance metrics benchmark
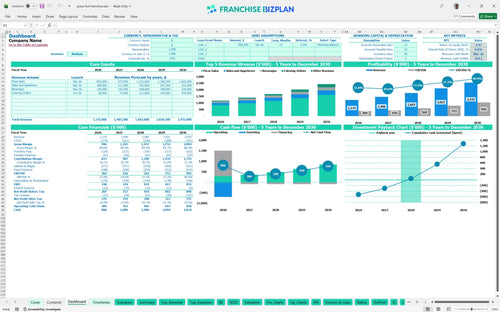
We built this model using our own research to ensure the unit economics reflect the reality of a high-volume pizza operation. The key assumptions, including revenue streams, staffing for crew members, and the 6% royalty fees, are pre-populated with researched data specific to this franchise unit and are fully editable. With a Year 1 EBITDA of $364,000, this tool gives you a credible starting point for your own projections and defintely helps with bank discussions.
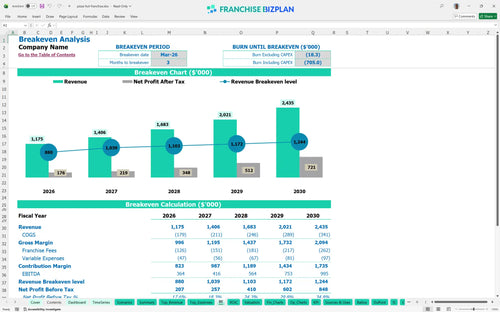
This franchise unit hits its stride quickly, reaching break-even in just 3 months by March 2026. With Year 1 EBITDA projected at $364,000, the model accounts for the 6% royalty and 4.75% marketing fees that impact your bottom line from day one. This QSR profitability analysis shows that early volume is the key to covering your fixed overhead.
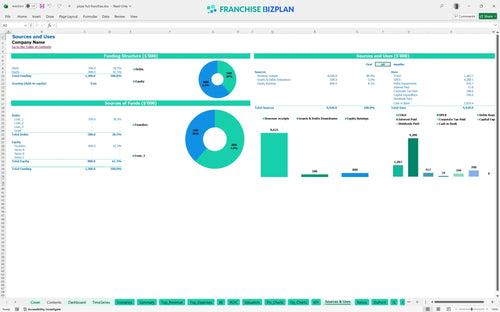
You will need approximately $700,000 to get this store off the ground in the US. This covers the $25,000 franchise fee, significant leasehold improvements of $280,000, and the specialized kitchen equipment needed for high-volume production. Using this startup cost breakdown for quick service restaurant franchise ensures you don't miss the $40,000 for delivery vehicles.
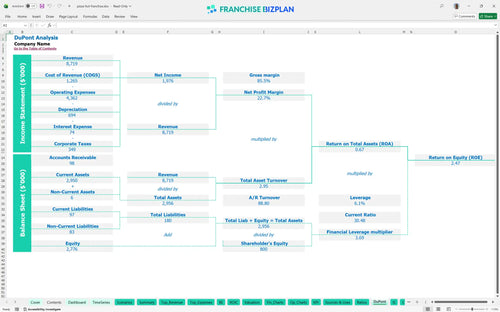
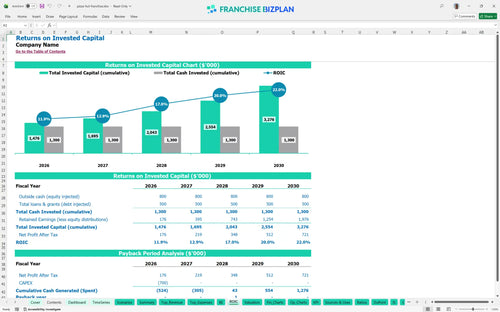
Investors can expect a 4.58% Internal Rate of Return and a 3-year payback period. While the ROE sits at 2.47%, the steady climb in EBITDA to $995,000 by Year 5 shows the long-term value of the unit. This franchise investment calculator helps you see how the $2.4M terminal revenue impacts your exit multiple.
The unit reaches monthly break-even by March 2026, just three months after launch. Your ability to hit this depends heavily on maintaining a strong average ticket and managing the 13% food ingredient cost against the $11,000 monthly rent burden. This restaurant franchise cash flow analysis spreadsheet makes it easy to track these franchise unit economics.
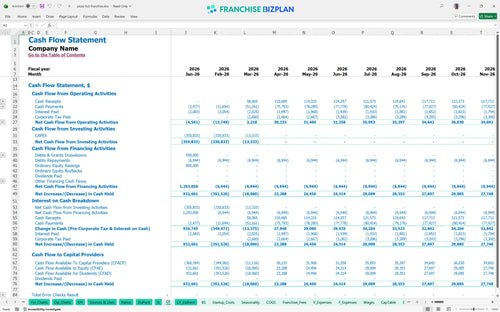
The lowest cash point is $563,000, occurring in March 2026 during the initial ramp-up. You need enough runway to cover the pre-opening months where rent and insurance are paid before the first pizza is sold. Proper financial planning for new restaurant franchise units requires keeping this buffer for unexpected delays.
A 10% drop in revenue can delay your 3-year payback significantly, while a high-performance scenario accelerates the $2.4M Year 5 revenue target. Using this franchise investment feasibility study template helps you stress-test the 2.7% delivery commission fees. Restaurant franchise expansion financial modeling is all about preparing for these swings.
This pizza franchise financial model is built in Excel so you can tweak every single lever. It comes with pre-filled formulas and editable assumptions, making it easy to adjust for your specific territory, local labor market, or site-specific rent. Honestly, having an Excel template for restaurant franchise financial projections is the only way to ensure your numbers reflect the reality of your local street corner rather than a corporate average.

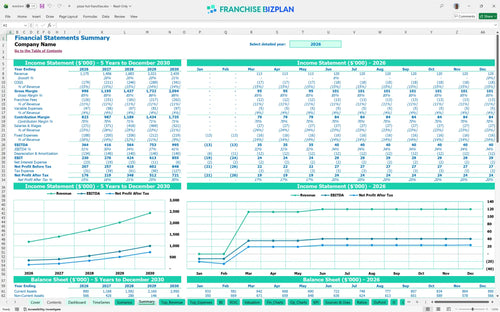
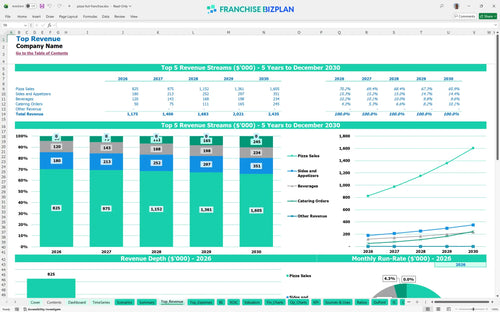
Success in the pizza business isn't about the first month; it is about the first five years. This model provides a detailed business cash flow projection and a full restaurant franchise business plan view, tracking revenue from Year 1 at $1.17M up to $2.43M by Year 5. You can see exactly how scaling your catering and delivery streams impacts your long-term store-level EBITDA.

The model handles the heavy lifting of calculating your ongoing obligations to the franchisor. It factors in the 6% franchise royalty fees and the 4.75% marketing fund contribution automatically based on your gross sales. This ensures you see the true net cash flow after the brand takes its cut, which is vital for any realistic QSR unit analysis.

Knowing how to calculate startup costs for a pizza franchise is the difference between a smooth opening and a cash crunch. This franchise startup cost template totals your initial investment-roughly $700,000 in this scenario-and maps it against your monthly margins. You will see exactly when you hit the break-even point, which this model estimates at month three.

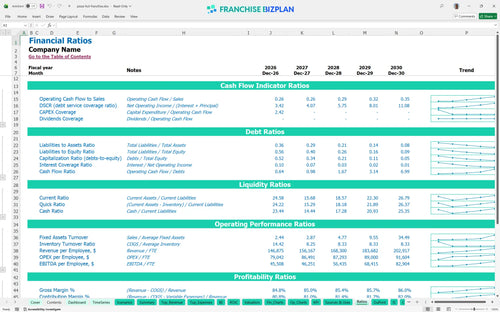
We have baked in standard restaurant operating expenses and franchise unit financial performance metrics so you can sanity-check your plan. From the $11,000 monthly rent to the 13% food cost target, these benchmarks help you see if your projections are aggressive or realistic. If your labor costs drift too far from the model, you know exactly where to look.


Simply purchase and download the financial model template, then access it instantly using Microsoft Excel or Google Sheets. No installation or technical expertise required-just open and start working.

Enter your business-specific numbers, including revenue projections, costs, and investment details. The pre-built formulas will automatically calculate financial insights, saving you time and effort.

Leverage the investor-ready format to confidently showcase your financial projections to banks, franchise representatives, or investors. Impress stakeholders with clear, data-driven insights and professional reports.

Leverage the investor-ready format to confidently present your projections to banks, franchise representatives, or investors.