
All-in-one Dashboard
Core inputs and core outputs


This franchise financial projection spreadsheet provides a complete roadmap for navigating the costs and revenue potential of a high-volume pizza delivery and carryout unit.
Core inputs and core outputs
Three scenario analysis
Presentation ready
DuPont analysis
Researched revenue assumptions
Lender-friendly financial outputs
Revenue stream detailed view
Performance metrics benchmark
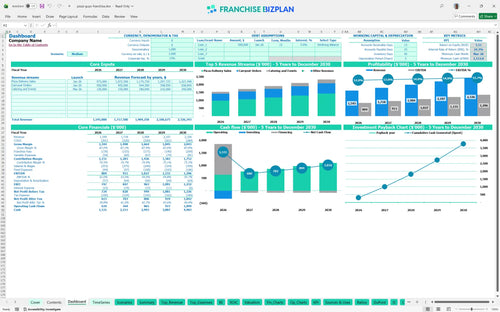
We built this pizza franchise business plan using deep-dive research into high-performance delivery models. Key assumptions like the $650,000 initial delivery revenue and 9% total franchise fees are pre-populated but fully editable to match your local market. It is a pragmatic tool designed to show you exactly how store-level EBITDA can hit $804,000 in year one.
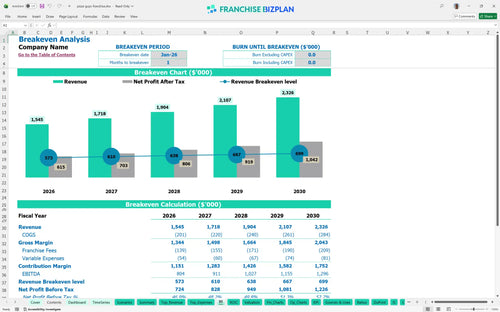
This unit hits the ground running with a break-even point in the very first month, Jan-2026, thanks to strong initial demand. By year one, you are looking at an EBITDA of $804,000 after accounting for food costs, 5% royalties, and a $60,000 manager salary. Speed to profit is the primary goal here.
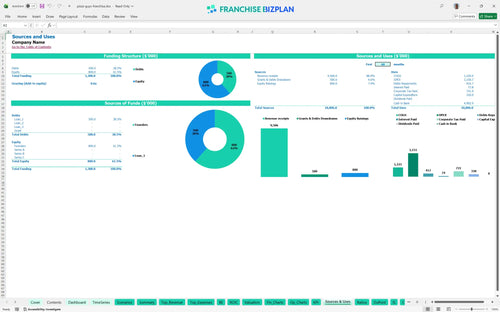
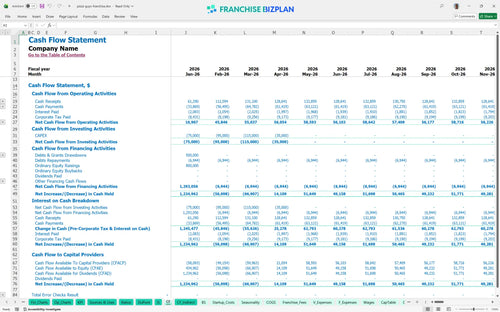
You will need approximately $320,000 to cover the initial build-out and equipment, plus a significant cash buffer for the first quarter. The model shows a minimum cash requirement of $1.112M in March 2026 to handle the timing of payables and initial scaling. Capital is the fuel that prevents a mid-launch stall.
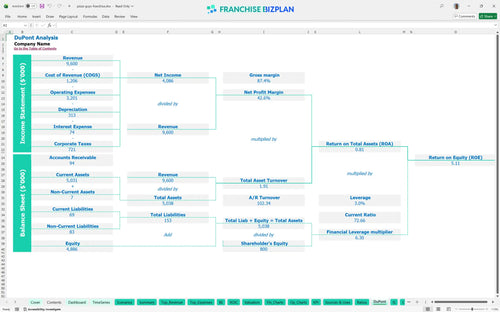
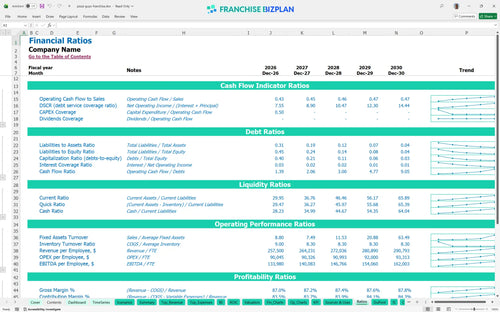
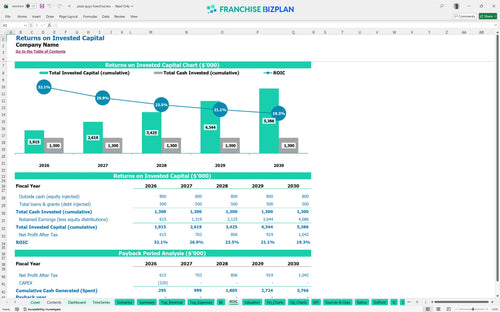
Investors can expect a solid Internal Rate of Return (IRR) of 24.32% over the five-year hold period. While the full payback of the initial investment occurs after year five, the consistent cash flow and 5.11 ROE make this a stable multi-unit play. Equity builds steadily as you scale.
The unit breaks even almost immediately in Jan-2026, provided you hit the $1.54M annual revenue run rate. The biggest driver for this quick start is the high-margin delivery mix, which offsets the $5,500 monthly rent and fixed utilities. Watch your labor costs closely to keep this timeline intact.
Your lowest cash point occurs in March 2026, where the model estimates you will need $1.112M on hand to navigate pre-opening costs and initial inventory loads. We recommend keeping a 90-day operating buffer to handle any delays in the $150,000 leasehold improvement phase. Cash is king, but timing is the kingdom.
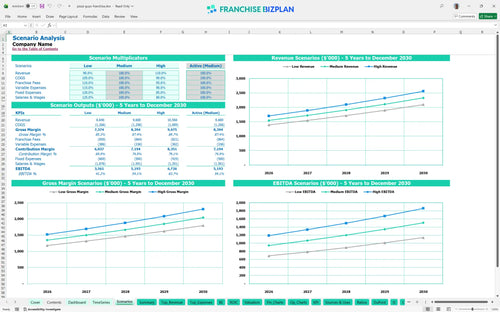
Moving from a medium to a high-revenue scenario significantly boosts your year-1 EBITDA past the $804,000 baseline. Conversely, a low-growth scenario where delivery volume lags by 15% would push your payback period much further out and tighten the $1.1M cash floor. Scenarios turn what-ifs into actionable contingency plans.
Finance: update unit break-even and payback model by Friday.
This franchise unit financial model lives in Excel, giving you total control over every line item from dough costs to driver wages. You can swap out the pre-filled assumptions for your specific territory to see how local rent or labor laws shift your bottom line. It is defintely the fastest way to stress-test your assumptions before signing a lease.

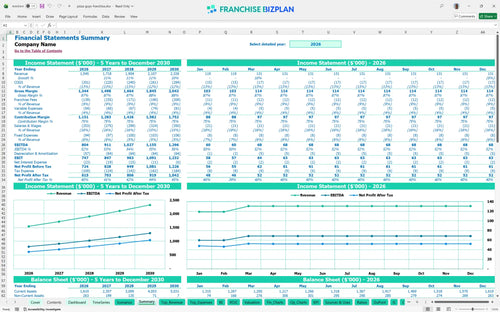
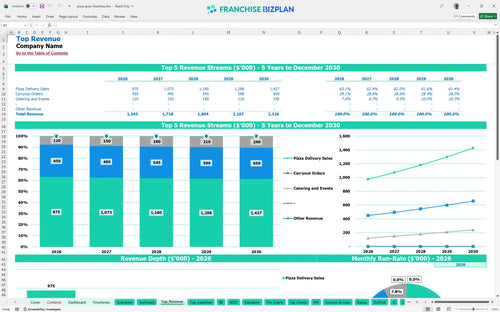
We map out your trajectory from opening day through year five, showing how a $1.54M starting revenue can scale to over $2.3M. This view helps you anticipate when to add that fourth or fifth delivery driver as volume grows. Long-term planning is the difference between a job and a scalable business.

The model bakes in the 5% royalty and 4% marketing fund contributions right off the top, so you never mistake gross sales for spendable cash. By tracking these alongside the initial $25,000 entry fee, you get a clear picture of the true cost of brand support. Don't let corporate fees surprise your bank account.

Launching requires a clear view of the $320,000 in upfront capital, covering everything from kitchen ovens to leasehold improvements. Our break-even analysis identifies the exact monthly volume needed to stop burning cash and start building equity. Knowing your zero point keeps the stress manageable during the ramp-up phase.

We include standard pizza industry ranges for food costs and labor so you can see if your 10% ingredient spend is realistic or too optimistic. Comparing your unit to these benchmarks helps identify margin leaks before they become systemic problems. If your numbers look too good to be true, they probably are.


Simply purchase and download the financial model template, then access it instantly using Microsoft Excel or Google Sheets. No installation or technical expertise required-just open and start working.

Enter your business-specific numbers, including revenue projections, costs, and investment details. The pre-built formulas will automatically calculate financial insights, saving you time and effort.

Leverage the investor-ready format to confidently showcase your financial projections to banks, franchise representatives, or investors. Impress stakeholders with clear, data-driven insights and professional reports.

Leverage the investor-ready format to confidently present your projections to banks, franchise representatives, or investors.