
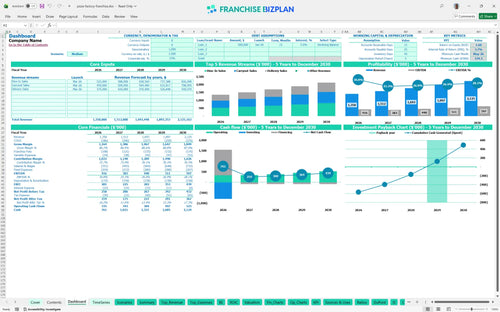
All-in-one Dashboard
Core inputs and core outputs


This pizza restaurant financial model excel template includes detailed revenue builds, staffing plans, capital expenditure forecasting, and full 5-year financial statements for a single unit.
Core inputs and core outputs
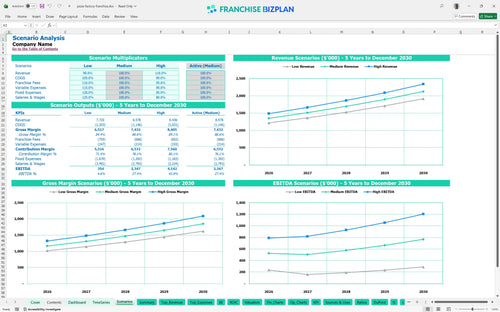
Three scenario analysis
Presentation ready
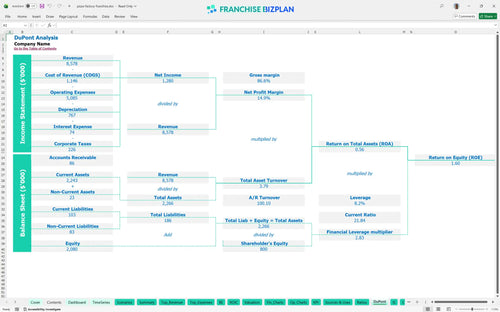
DuPont analysis
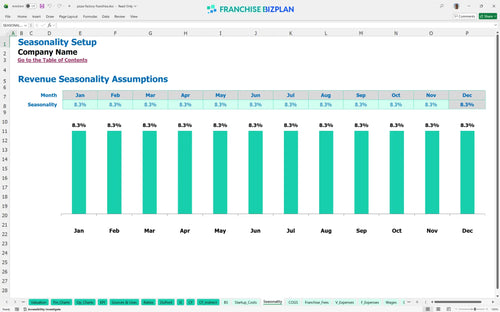
Researched revenue assumptions
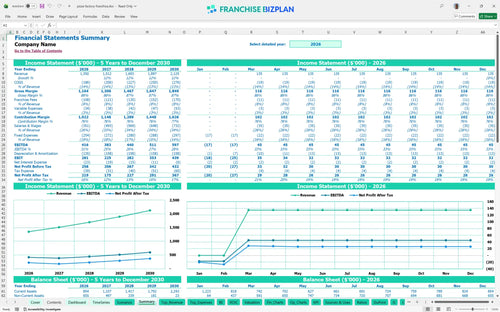
Lender-friendly financial outputs
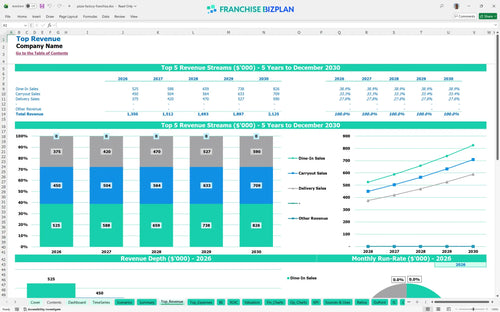
Revenue stream detailed view
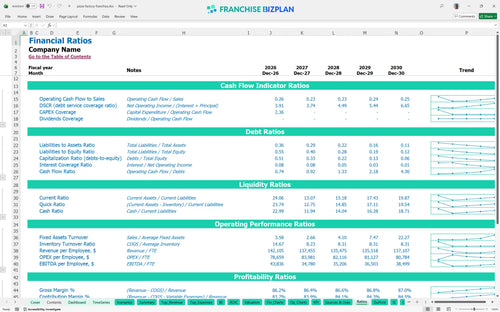
Performance metrics benchmark
We built this pizza shop profitability analysis using deep-dive research into high-traffic suburban pizza units. Key assumptions like the $25,000 franchise fee and the $15,000 monthly rent for prime locations are pre-populated but fully editable. With an initial EBITDA of $416,000, the model helps you track if your 'Express Pickup' lane and delivery fleet are pulling their weight.
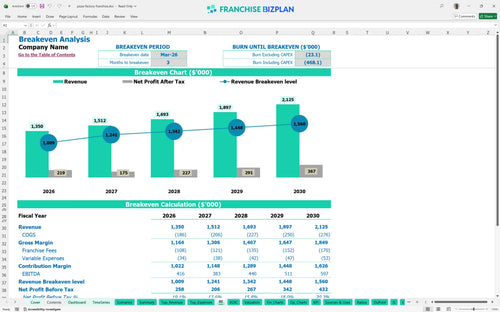
The unit hits monthly break-even by March 2026, just three months after launch. By the end of year one, you are looking at an EBITDA calculation of $416,000, which grows to $597,000 by year five as delivery and carryout volume matures. Profit isn't just about sales; it's about what stays in the till.
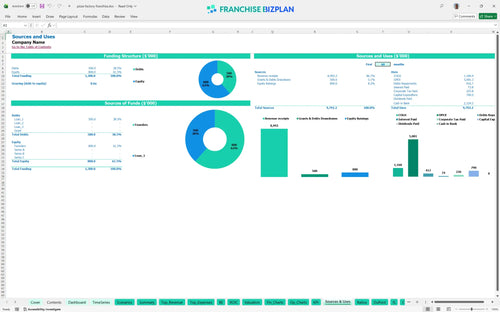
You will need roughly $790,000 in startup capital to get the doors open, according to our franchising startup capital requirements template. This covers everything from the $25,000 franchise fee to $120,000 for high-end pizza ovens and $75,000 for a branded delivery fleet. Every dollar in build-out is a dollar that needs to be earned back.
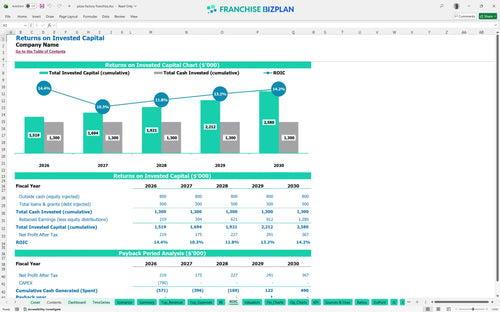
Analyzing ROI for a new pizza restaurant location shows a 4-year payback period on your initial investment. While the IRR is 3.73% over the five-year window, the ROE of 1.6 shows steady equity building as the unit matures. Patience is a virtue, but a 4-year payback is a solid plan.
You hit the break-even point in March 2026, which is month three of operations. The biggest driver for this is managing estimating operating expenses for a new franchise unit, specifically the $15,000 monthly rent and the $24,500 monthly management and staff salary base. Fixed costs are the mountain you have to climb every month.
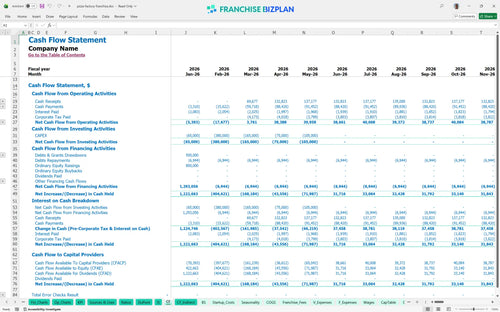
Your lowest cash point is projected for May 2026 at $534,000, which is why this restaurant franchise cash flow forecasting tool is essential. This suggests you need a healthy working capital reserve to handle the gap between your $790,000 build-out and the ramp-up of daily sales. Cash is oxygen, and you can't afford to hold your breath.
This financial feasibility study for restaurant franchise allows you to toggle between Low, Medium, and High scenarios. A 'High' case would see faster delivery adoption, while a 'Low' case might see occupancy costs eating up to 15% of your gross, delaying your 4-year payback. Hope for the high case, but build for the low case.
Finance: update unit break-even and payback model by Friday
This pizza franchise financial model is built in Excel with fully editable assumptions, allowing you to tweak everything from dough-tossing labor hours to delivery vehicle maintenance. It is designed so you can plug in your specific territory data and see exactly how it hits your bottom line. It's your business, so you should control the numbers.

We mapped out a 60-month trajectory showing a franchise unit financial projection where revenue climbs from $1,350,000 in year one to over $2,125,000 by year five. This isn't just a top-line guess; it factors in the ramp-up of dine-in, carryout, and delivery channels. Five years is a lifetime in pizza, but you need a map.

The model bakes in the 5% royalty and 3% marketing fee right into the monthly P&L to account for franchise overhead costs accurately. At $1,350,000 in annual sales, that means $108,000 goes back to the brand before you cover local rent or labor. Royalties are the price of the brand, so track them closely.

Knowing how to calculate startup costs for a pizza franchise is vital when leasehold improvements alone hit $350,000. The model calculates exactly when your monthly sales cover both fixed and variable costs to reach a clear break-even analysis. Speed to break-even is the only metric that lets you sleep at night.

We include industry-standard unit economics for pizza shop profitability analysis to ensure your labor and food costs stay in line with top performers. For instance, food ingredients start at 12% of sales, which is lean for the industry but requires tight inventory management. Benchmarks are defintely the sanity check every CFO needs.


Simply purchase and download the financial model template, then access it instantly using Microsoft Excel or Google Sheets. No installation or technical expertise required-just open and start working.

Enter your business-specific numbers, including revenue projections, costs, and investment details. The pre-built formulas will automatically calculate financial insights, saving you time and effort.

Leverage the investor-ready format to confidently showcase your financial projections to banks, franchise representatives, or investors. Impress stakeholders with clear, data-driven insights and professional reports.

Leverage the investor-ready format to confidently present your projections to banks, franchise representatives, or investors.