
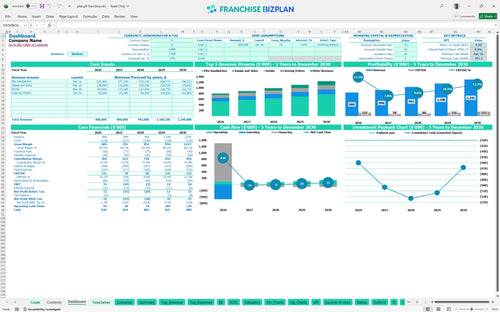
All-in-one Dashboard
Core inputs and core outputs


This Excel template for franchise unit financial forecasting provides a complete roadmap for your store's fiscal health.
Core inputs and core outputs
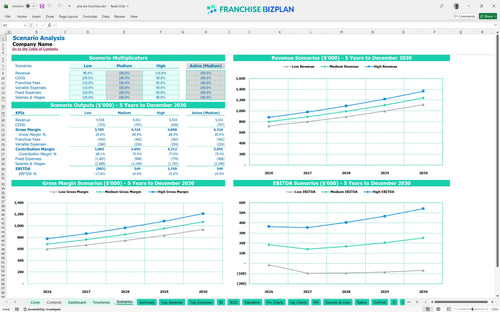
Three scenario analysis
Presentation ready
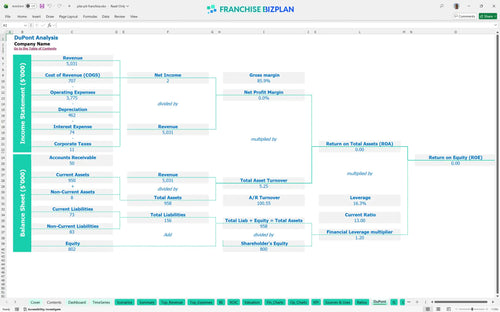
DuPont analysis
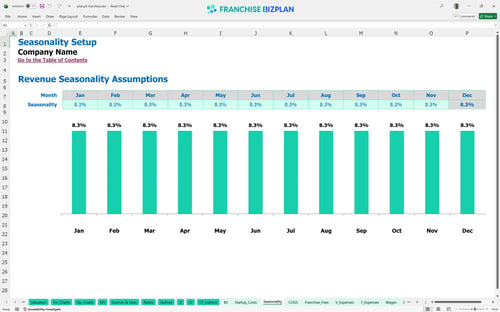
Researched revenue assumptions
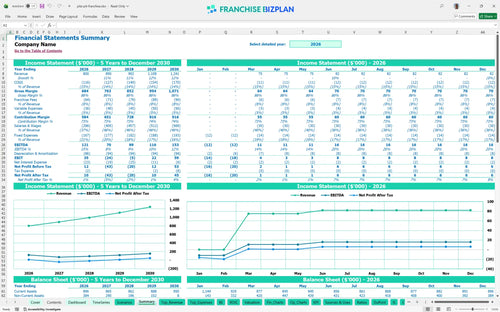
Lender-friendly financial outputs
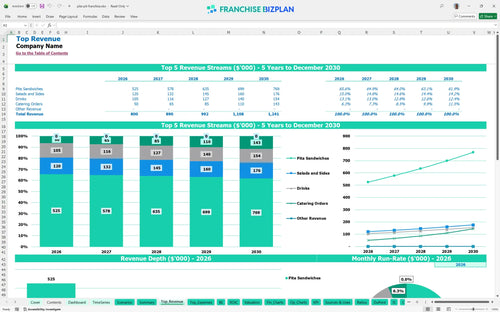
Revenue stream detailed view
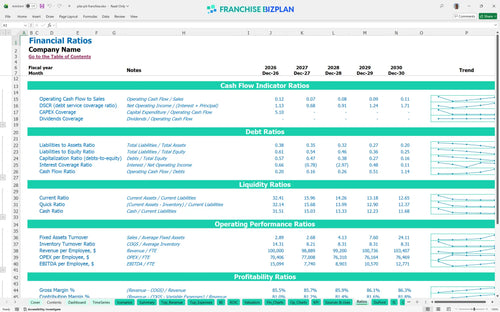
Performance metrics benchmark
We built this model using detailed research on the pita sandwich segment. Key assumptions like the $250,000 leasehold improvement cost and the 8% combined royalty and marketing fee are pre-populated and ready for your input. With year-one revenue projected at $800,000, this tool helps you stress-test every dollar before you sign the lease. It is defintely the most precise way to plan your Austin launch.
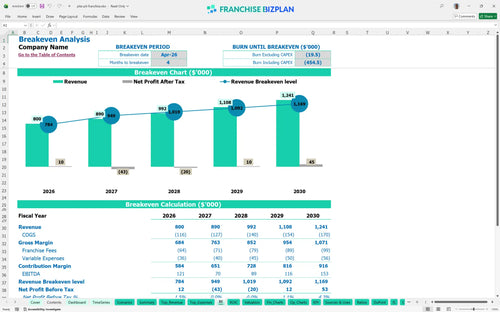
This unit reaches its break-even analysis point in April 2026, just four months after launching. While EBITDA starts at $121,000 in year one, it fluctuates as you scale staffing to meet the $1.24 million revenue target in year five. Here is the quick math: your margin depends on keeping food costs at 12%.
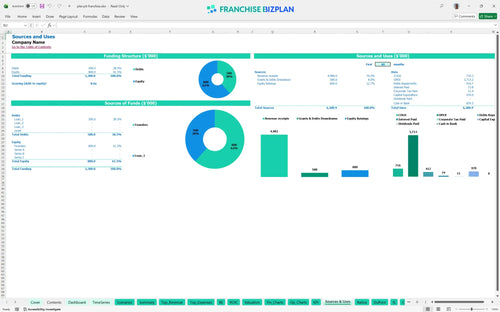
You will need a startup budget template for small food franchise unit that accounts for roughly $470,000 in initial capital. This covers everything from the $20,000 franchise fee to the heavy lifting of $250,000 in leasehold improvements. Plus, you need to account for $110,000 in kitchen equipment before the first pita is grilled.
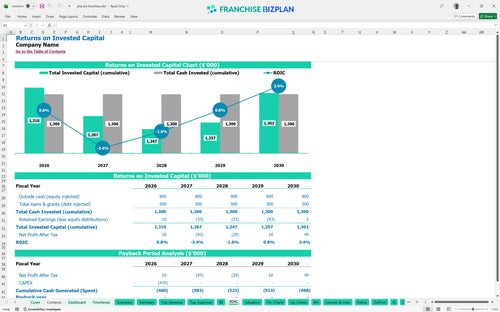
The franchise ROI calculation shows a payback period extending beyond the five-year mark, with an IRR of -0.02%. This suggests that while the unit generates positive EBITDA, the high initial capex requires long-term commitment to see a full return on your equity. To be fair, this estimate hides the potential resale value of a mature unit.
To hit break-even by April 2026, you need to manage a monthly rent of $10,000 alongside your variable costs. The restaurant franchise business plan hinges on maintaining a food cost percentage near 12% to ensure your margins aren't eaten by ingredients. Break-even depends less on headline sales and more on repeat demand.
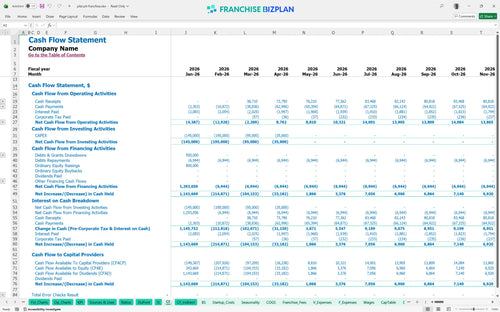
Your lowest cash point occurs in April 2026, with a minimum cash requirement of $791,000. This franchise unit cash flow projection spreadsheet highlights the need for a significant buffer to cover the gap between build-out and consistent catering revenue. If opening takes 90+ days longer than planned, working capital pressure rises fast.
This financial model for fast-casual restaurant franchise allows you to toggle between performance levels. A High scenario, driven by strong catering orders and UT student traffic, could pull the payback period forward, while a Low scenario might extend the cash burn past the four-month mark. Every 1-point margin leak matters in a single-unit model.
This franchise financial model template lives in Excel, so you can tweak every variable to match your specific Austin territory. Whether you are adjusting the price of a pita or shifting your labor mix for late-night rushes, the pre-filled formulas handle the heavy lifting. It is built to be a living document that grows with your store. Honestly, the math only works if you can adjust for local reality.

Success in the fast-casual space requires looking past the grand opening. This food service financial projection model forecasts your path from an initial $800,000 in year one to over $1.2 million by year five. We track the full P&L so you can see how incremental sales growth impacts your bottom line over a half-decade. One-point margin leaks matter fast in a single-unit model.

Royalties and marketing funds are the franchise tax that never goes away. This model bakes in the 6% royalty and 2% marketing fee right from the start. By automating these calculations, you can see exactly how much cash leaves the business before you pay your own rent or staff. Still, these fees are the price of brand recognition and support.

Use this franchise startup cost calculator to visualize the $470,000 needed for build-out and equipment. We help you find the break-even analysis point-which hits in April 2026 for this model-so you know the exact day you stop burning cash. Knowing your zero day is vital for managing your initial bankroll. Timing gaps between opening and ramp-up can sink a store.

Don't fly blind when evaluating franchise profitability before buying. The model includes benchmarks for food costs, which we project starting at 12% for ingredients. If your actuals drift too far from these standards, you will know immediately that your portion control or waste management needs a fix. Real-world margins depend on manager productivity and local density.


Simply purchase and download the financial model template, then access it instantly using Microsoft Excel or Google Sheets. No installation or technical expertise required-just open and start working.

Enter your business-specific numbers, including revenue projections, costs, and investment details. The pre-built formulas will automatically calculate financial insights, saving you time and effort.

Leverage the investor-ready format to confidently showcase your financial projections to banks, franchise representatives, or investors. Impress stakeholders with clear, data-driven insights and professional reports.

Leverage the investor-ready format to confidently present your projections to banks, franchise representatives, or investors.