
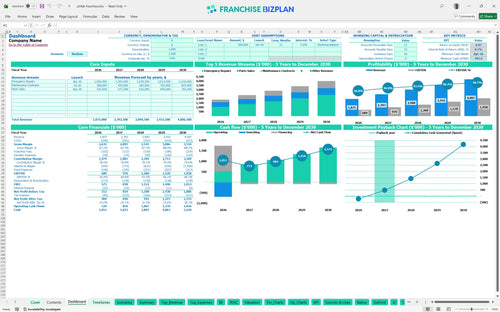
All-in-one Dashboard
Core inputs and core outputs


This financial model for B2B mobile hydraulic repair business includes a franchise unit profit and loss template, 5-year projections, and a detailed startup capital requirements for mobile industrial service franchise operations.
Core inputs and core outputs
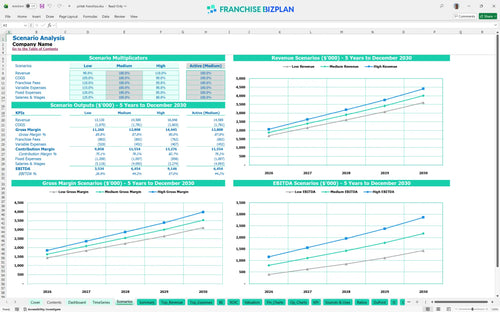
Three scenario analysis
Presentation ready
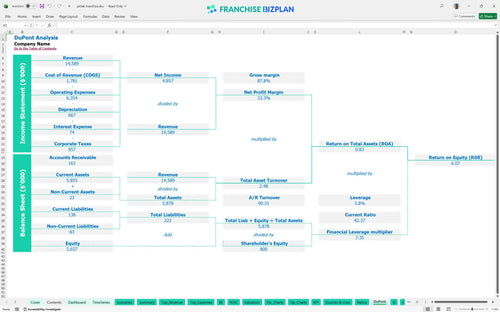
DuPont analysis
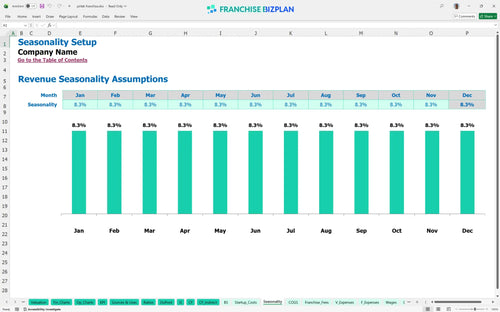
Researched revenue assumptions
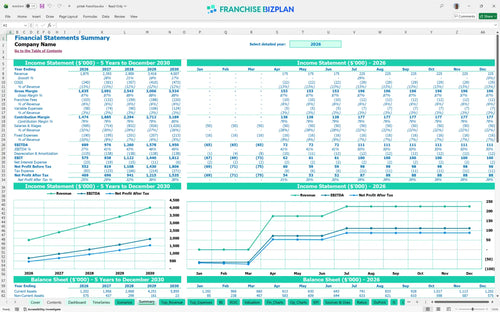
Lender-friendly financial outputs
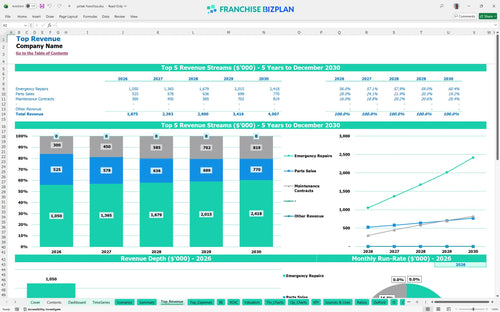
Revenue stream detailed view
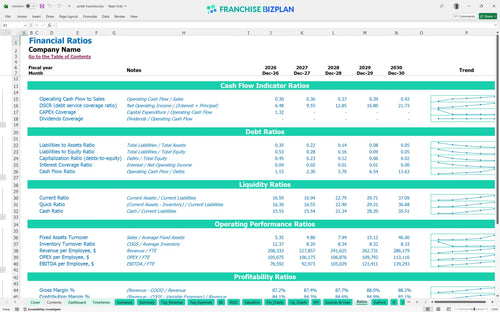
Performance metrics benchmark
We built this industrial service franchise business plan using our own research to ensure the numbers reflect actual field conditions. Key assumptions including revenue streams like Emergency Repairs ($700,000 in Year 1) and Parts Sales ($350,000), along with the $55,000 franchise fee and 4% royalty, are pre-populated and fully editable. This model helps you visualize a Year 1 EBITDA of $689,000 and helps in estimating ROI for industrial mobile service franchise territories.
This hydraulic repair business financial model shows the unit becomes profitable in its first year, generating $689,000 in EBITDA. As you scale from four to eight mobile technicians by Year 5, annual EBITDA is projected to reach $1,950,000, driven by high-margin emergency service fees and recurring maintenance contracts.
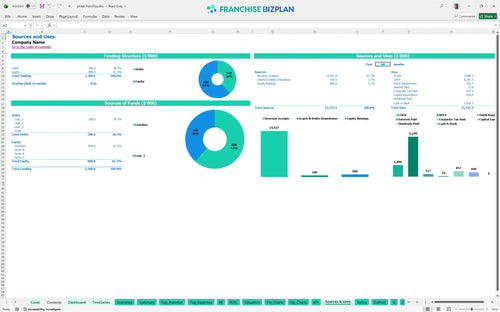
The startup capital requirements for mobile industrial service franchise operations total approximately $1.18M, including a $55,000 franchise fee and $420,000 for three mobile service vehicles. This also covers $100,000 in leasehold improvements for your hub and a $492,000 cash buffer to handle the initial ramp-up phase.
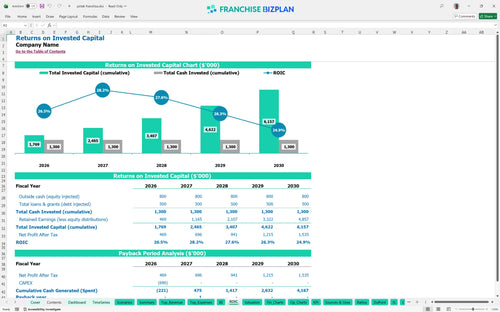
The franchise investment analysis indicates a 2-year payback period, which is exceptionally fast for an equipment-heavy business. With an internal rate of return (IRR) of 8.67% and a return on equity (ROE) of 6.07%, the unit offers a stable path to building long-term equity through industrial service delivery.
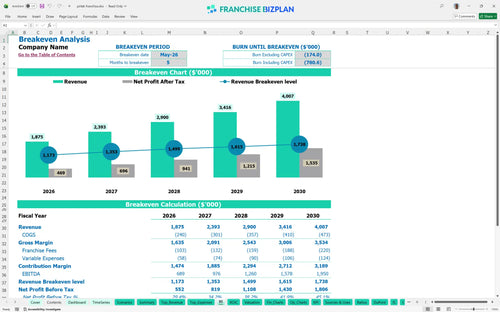
The break-even analysis for franchises like this shows a 5-month timeline, with the break-even date occurring in May 2026. To hit this, you must generate enough volume to cover $8,000 in monthly rent and $356,000 in Year 1 technician wages while maintaining a 4% royalty burden.
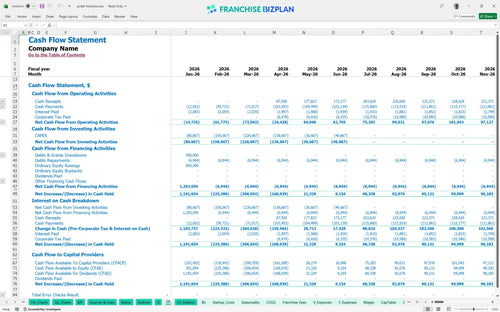
The lowest cash point is $492,000 in April 2026, just before the unit hits break-even. Using this franchise unit cash flow projection spreadsheet, you can see that you defintely need to manage the timing of your $140,000 vehicle purchases to ensure you don't outpace your revenue growth during the first quarter.
The franchise unit financial projections for equipment services allow you to toggle between Low, Medium, and High scenarios to see the impact on your $1.87M Year 1 revenue. A High scenario focused on B2B service franchise profitability could shorten your payback period by increasing the ratio of premium emergency jobs to standard parts sales.
Finance: update unit break-even and payback model by Friday.
This franchise financial model template is built in Excel, allowing you to edit every assumption to fit your specific market. We provide pre-filled formulas for mobile fleet operation costs and revenue drivers, making it easy to adapt the model to your territory's unique industrial demand and labor rates.

Plan your growth with a financial spreadsheet template for industrial service franchise operations that covers 60 months of performance. The model tracks the transition from a single mobile unit to a full fleet, providing an Excel template for multi-unit franchise financial planning with detailed balance sheets and cash flow statements.

This tool functions as a franchise royalty fee calculator, automatically applying the 4% royalty and 1.5% marketing fund contributions to your gross sales. It ensures you account for the $55,000 initial fee and ongoing brand obligations so your store-level margin remains accurate and transparent.

Knowing how to calculate startup costs for a mobile repair franchise is critical for securing funding. This model aggregates mobile service franchise startup costs, including specialized vehicles and diagnostic tools, to provide a clear break-even analysis for franchises based on monthly fixed overhead and variable job costs.

The model includes a profitability forecast for hydraulic hose replacement business units based on verified industry standards. You can compare your projected 11% hose and fitting costs against typical benchmarks to ensure your pricing strategy and inventory management are competitive for the B2B sector.


Simply purchase and download the financial model template, then access it instantly using Microsoft Excel or Google Sheets. No installation or technical expertise required-just open and start working.

Enter your business-specific numbers, including revenue projections, costs, and investment details. The pre-built formulas will automatically calculate financial insights, saving you time and effort.

Leverage the investor-ready format to confidently showcase your financial projections to banks, franchise representatives, or investors. Impress stakeholders with clear, data-driven insights and professional reports.

Leverage the investor-ready format to confidently present your projections to banks, franchise representatives, or investors.