
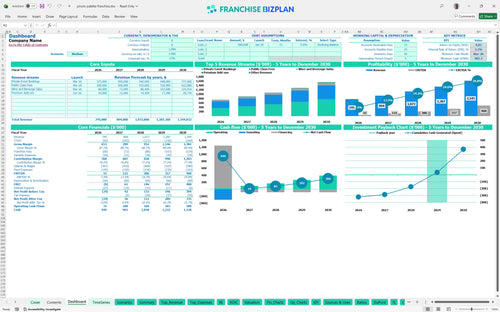
All-in-one Dashboard
Core inputs and core outputs


This comprehensive Excel financial model template for creative studio franchise units provides everything you need to project revenue, manage expenses, and calculate total ROI.
Core inputs and core outputs
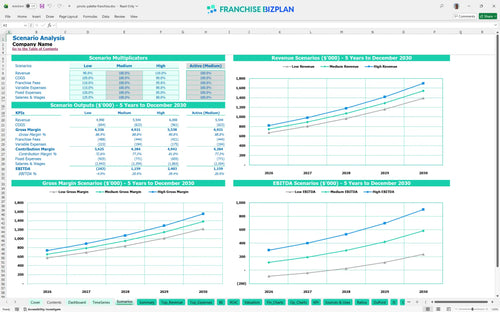
Three scenario analysis
Presentation ready
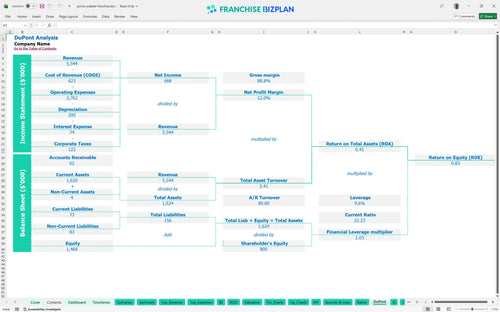
DuPont analysis
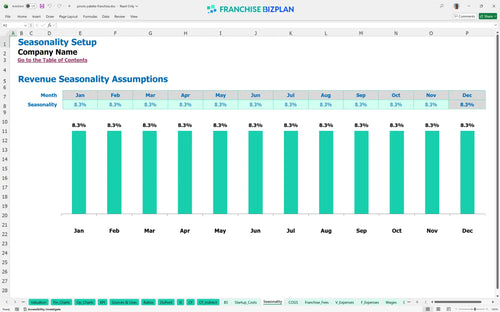
Researched revenue assumptions
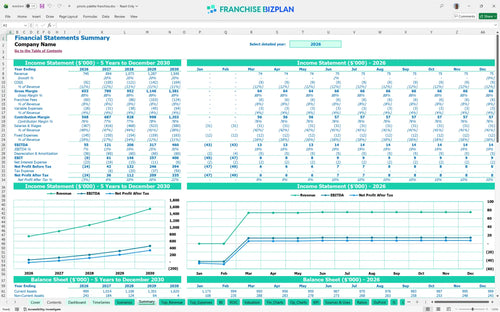
Lender-friendly financial outputs
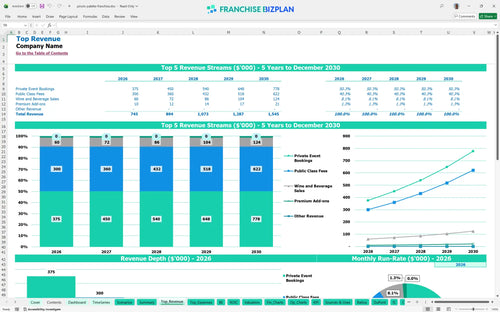
Revenue stream detailed view
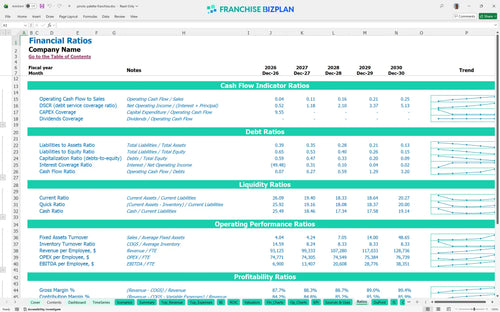
Performance metrics benchmark
We built this franchise unit financial model using our own research into the creative entertainment sector. Key assumptions for revenue streams like private events and public classes, plus operating expenses and royalty fees, are pre-populated with data specific to this boutique studio model. With a year-one revenue target of $745,000 and a 4-year payback period, the model provides a realistic roadmap for prospective owners. Honestly, the focus on high-margin private events is what makes this specific unit work.
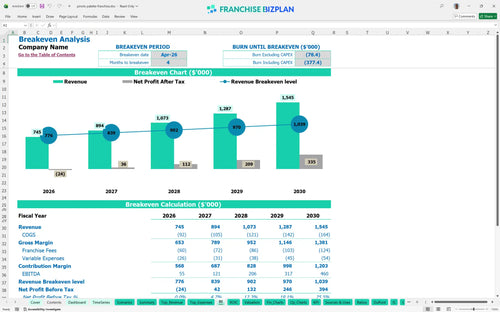
The unit reaches profitability quickly, with the break-even point occurring in April 2026, just four months after launch. This trajectory defintely depends on hitting the $745,000 revenue target in the first year while keeping EBITDA at $55,000. By year five, EBITDA is projected to climb to $460,000 as the studio matures and optimizes its cost structure. Margins improve as art supply costs drop from 9.5% to 8.2% through better inventory management. Efficiency is the secret sauce for long-term gains.
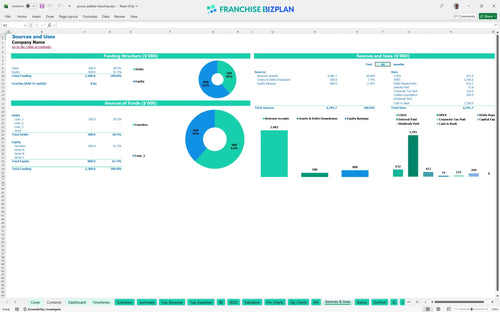
You need approximately $299,000 in total capital to cover the initial startup costs and technology integrations. This includes a $30,000 franchise fee, $140,000 for leasehold improvements, and $28,000 for specialized augmented reality technology. The model also accounts for furniture, fixtures, and a $12,000 security system to protect the asset. Having a clear breakdown of these uses ensures you don't run out of cash before the doors open.
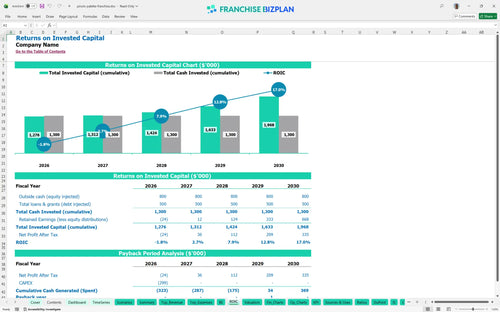
The model estimates an Internal Rate of Return (IRR) of 3.1% and a Return on Equity (ROE) of 0.83 over the initial five-year period. You can expect a full payback of your initial investment within 4 years, provided the studio hits its growth targets. While the IRR is conservative, the steady climb in annual EBITDA suggests strong long-term cash flow potential. A 4-year payback is standard for retail entertainment concepts with high build-out costs.
Monthly break-even is achieved in April 2026, driven by a combination of public class fees and high-margin private event bookings. The biggest pressure on break-even is the $8,000 monthly rent and the $155,000 annual management payroll. If you can fill just two extra private events per month, you significantly lower the risk of a monthly loss. Volume is the primary lever in this high-fixed-cost model.
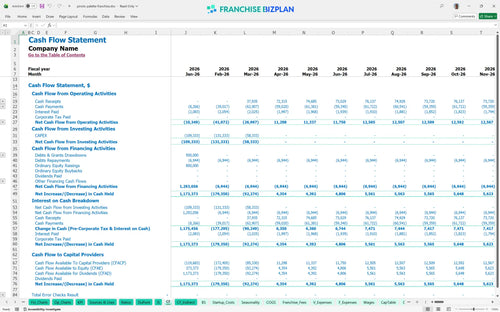
The lowest cash point occurs in March 2026, with a minimum cash balance of $902,000, assuming you start with a significant capital reserve. This period covers the final tech integrations and pre-opening marketing spend before revenue begins to scale. You should maintain a healthy buffer to handle the $11,000+ in monthly fixed expenses during the first quarter. Cash is king during the first 120 days of operation.
The high-growth scenario assumes revenue scales from $745,000 to $1.545 million, significantly shortening the payback period and boosting the year-5 EBITDA to $460,000. In a low-growth case, high fixed costs like the $8,000 rent and 8% total franchise fees will squeeze margins, potentially pushing the break-even date further out. Comparing these scenarios helps you understand the impact of local marketing and referral networks on your bottom line. Execution at the local level determines which scenario becomes your reality.
This franchise financial model template is built in Excel with fully editable assumptions, allowing you to swap out local rent, labor rates, and supply costs instantly. You can adjust the revenue drivers for public classes or private events to see how different booking volumes impact your bottom line. It is a flexible tool designed to handle the specific unit economics of a creative studio without the need for complex programming. Every 1-point margin leak matters fast in a single-unit model.

Plan your growth with a detailed 5-year franchise business plan spreadsheet that tracks revenue scaling from $745,000 in year one to over $1.5 million by year five. The model provides a clear view of how EBITDA (earnings before interest, taxes, depreciation, and amortization) matures as you optimize your artist staffing and beverage sales. Timing gaps between opening costs and mature-unit performance can sink a project if not mapped correctly. This long-term view helps you anticipate capital needs well before they become urgent.

Managing franchise-specific costs is simple with dedicated inputs for the 6% royalty and 2% marketing fund contributions. The model automatically calculates these fees based on your monthly revenue projections, ensuring you know exactly how much goes to the franchisor before you pay your local bills. At $745,000 in annual sales, these fees total nearly $60,000, so precision is vital for your cash flow planning. Understanding these fixed obligations is the first step to protecting your store-level margin.

Our franchise startup cost projection tool breaks down the initial investment, including the $30,000 franchise fee and $140,000 for leasehold improvements. It identifies the exact month you will hit your break-even point, which is currently estimated for April 2026. By separating fixed costs like the $8,000 monthly rent from variable costs like art supplies, you can see the minimum traffic needed to stay in the black. Knowing your numbers helps you sleep better during the ramp-up phase.

This franchise investment model includes researched benchmarks for creative entertainment studios, such as art supply costs ranging from 8.2% to 9.5% of revenue. You can compare your $65,000 studio manager salary and other labor inputs against industry standards to ensure your staffing plan is realistic. These benchmarks act as a sanity check for your franchise unit financial forecasting spreadsheet. If your costs are way off the average, the model helps you spot the leak early.


Simply purchase and download the financial model template, then access it instantly using Microsoft Excel or Google Sheets. No installation or technical expertise required-just open and start working.

Enter your business-specific numbers, including revenue projections, costs, and investment details. The pre-built formulas will automatically calculate financial insights, saving you time and effort.

Leverage the investor-ready format to confidently showcase your financial projections to banks, franchise representatives, or investors. Impress stakeholders with clear, data-driven insights and professional reports.

Leverage the investor-ready format to confidently present your projections to banks, franchise representatives, or investors.