
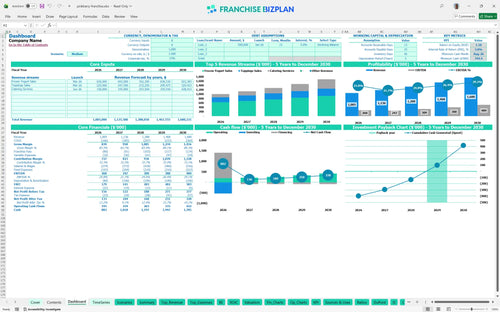
All-in-one Dashboard
Core inputs and core outputs


This comprehensive toolkit provides a dynamic frozen yogurt franchise financial model Excel template designed to help you forecast revenue, manage startup costs, and analyze long-term ROI.
Core inputs and core outputs
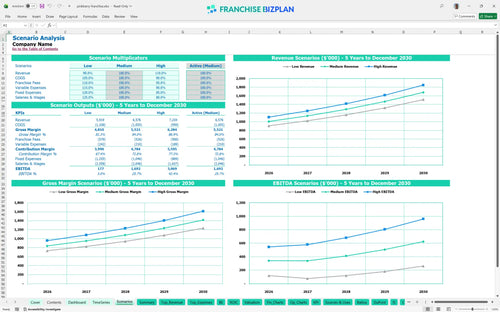
Three scenario analysis
Presentation ready
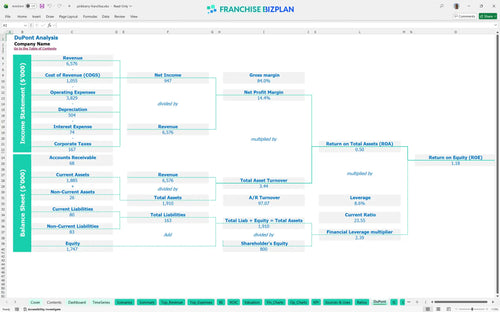
DuPont analysis
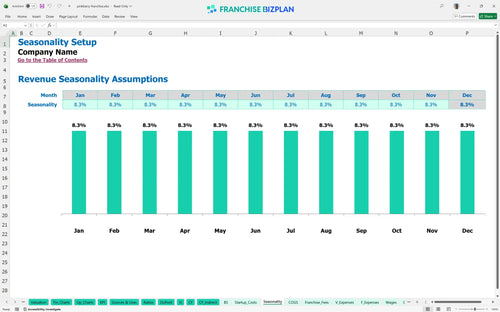
Researched revenue assumptions
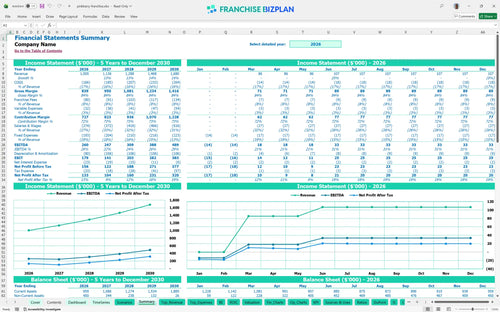
Lender-friendly financial outputs
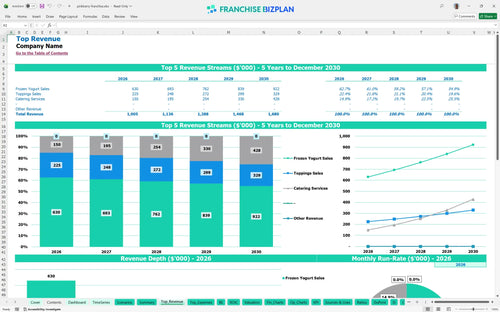
Revenue stream detailed view
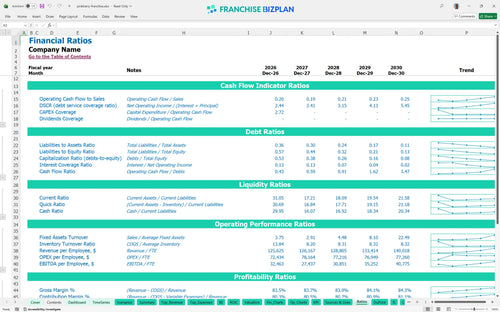
Performance metrics benchmark
We built this model using detailed research on premium frozen yogurt operations to ensure your projections are grounded in reality. The template comes pre-populated with $1,005,000 in year-one revenue and a $530,000 CAPEX (Capital Expenditure) budget, covering everything from $120,000 in yogurt machines to $30,000 for signage. You can easily tweak these researched assumptions to match your specific location and local labor market.
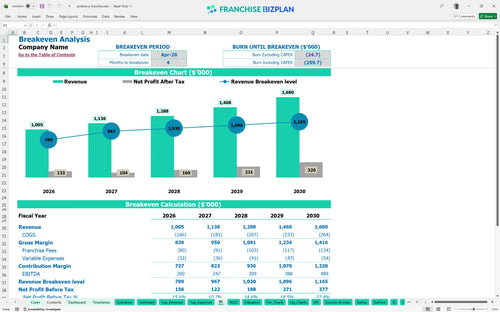
The unit hits monthly break-even by April 2026, just four months after launching. With year-one EBITDA starting at $260,000, the model shows a clear path to profitability as catering services scale. Here is the quick math: keeping yogurt ingredient costs at 14% is the key to protecting that margin.
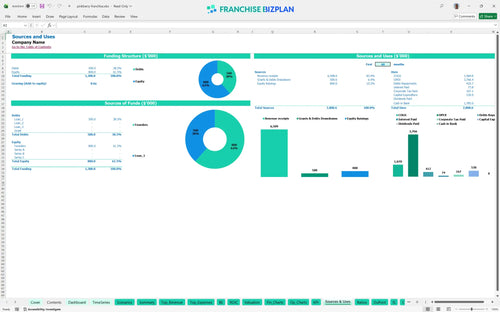
You will need roughly $530,000 in upfront capital for the build-out and equipment, plus a cash buffer. The total investment covers the $35,000 franchise fee and significant leasehold improvements to meet brand standards. What this estimate hides is the timing of the $120,000 machine purchase which happens months before the first sale.
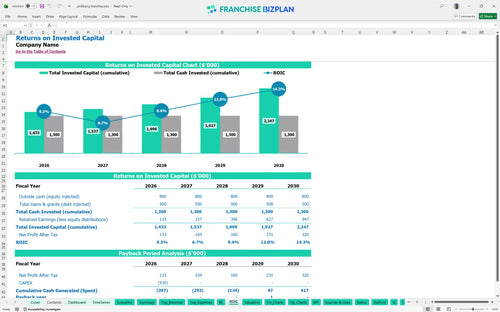
The model projects an IRR (Internal Rate of Return) of 3.79% with a full payback achieved in year 4. While the initial return seems modest, the ROE (Return on Equity) of 1.18 shows steady value creation as the unit matures. Still, your actual return depends heavily on hitting that $1M+ year-one revenue target.
The unit reaches its break-even point in April 2026, requiring about four months of operation to cover its fixed monthly costs. The $12,000 rent and $117,000 in initial annual management salaries are the biggest hurdles. To reach break-even faster, you must maximize throughput during peak evening hours.
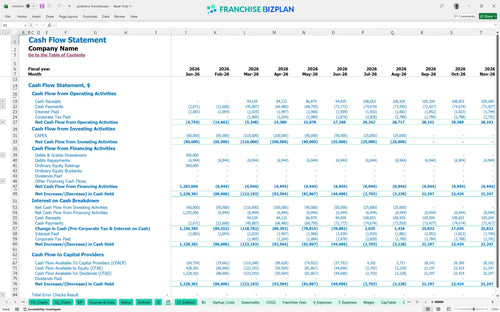
The lowest cash point occurs in August 2026 at $794,000, assuming you start with a healthy capitalization. You need enough runway to cover the $12,000 monthly rent and $1,800 in utilities during the ramp-up phase. If opening takes 90+ days longer than planned, the cash pressure will defintely rise.
The high-growth scenario assumes revenue climbs from $1.005M to $1.68M, significantly boosting year-5 EBITDA to $489,000. Low scenarios usually involve missing the $100,000 catering goal or seeing yogurt ingredients spike above 14%. Small shifts in the 6% royalty don't hurt as much as a 5% drop in average ticket prices.
This frozen yogurt franchise financial model is built entirely in Excel, giving you full control over every line item. We pre-filled the formulas and assumptions based on real-world dessert shop data, but you can easily adjust them to fit your specific territory or local real estate costs. It is a plug-and-play tool for anyone needing a franchise unit business plan template that actually works in the field.

Planning for a single unit requires looking past the grand opening to see how the numbers mature. This model provides retail franchise financial projections covering 60 months, showing revenue scaling from $1,005,000 in year one to $1,680,000 by year five. You can track how store-level EBITDA shifts as you add more crew members to handle the increased volume. Honestly, seeing the long-term cash flow is the only way to know if the debt service is manageable.

The model handles the heavy lifting of franchise-specific costs so you don't have to guess the impact on your margin. It calculates the 6% royalty fee and 2% marketing fund contribution automatically based on your gross sales. Plus, it accounts for the $35,000 initial franchise fee right at the start. Understanding these franchise unit economics is vital because that 8% off the top defintely changes your break-even math.

Calculating frozen yogurt shop startup costs is about more than just the machines; it is about the entire build-out. This tool breaks down the $530,000 in capital expenditures, including $200,000 for leasehold improvements and $120,000 for yogurt machines. It then maps these costs against your revenue to find the exact month you stop burning cash. A clear break-even analysis helps you sleep better when the doors first open.

We have integrated key financial metrics for evaluating franchise opportunities directly into the model logic. You can compare your 14% yogurt ingredient COGS (Cost of Goods Sold) and $12,000 monthly rent against typical industry standards. This helps you sanity-check your operating expense forecast before you sign a lease. If your labor costs for 6 crew members look high, the model will show you exactly how that eats your bottom line.


Simply purchase and download the financial model template, then access it instantly using Microsoft Excel or Google Sheets. No installation or technical expertise required-just open and start working.

Enter your business-specific numbers, including revenue projections, costs, and investment details. The pre-built formulas will automatically calculate financial insights, saving you time and effort.

Leverage the investor-ready format to confidently showcase your financial projections to banks, franchise representatives, or investors. Impress stakeholders with clear, data-driven insights and professional reports.

Leverage the investor-ready format to confidently present your projections to banks, franchise representatives, or investors.