
All-in-one Dashboard
Core inputs and core outputs


This comprehensive tool provides a detailed profit and loss statement and cash flow tracker to evaluate the viability of a high-volume retail grocery location.
Core inputs and core outputs
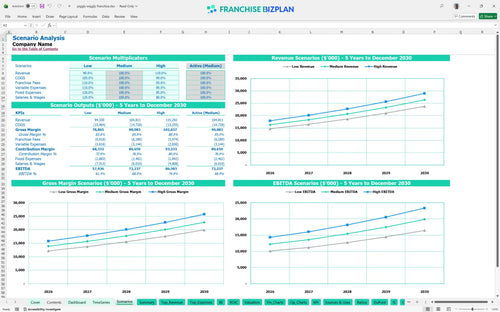
Three scenario analysis
Presentation ready
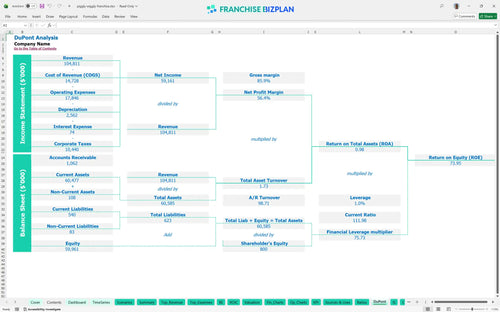
DuPont analysis
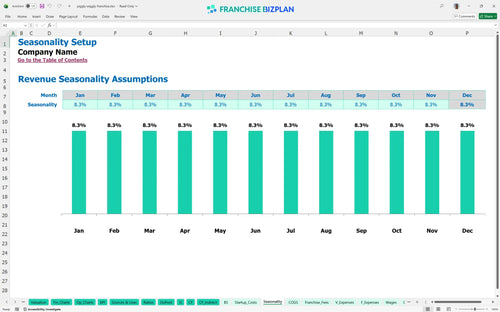
Researched revenue assumptions
Lender-friendly financial outputs
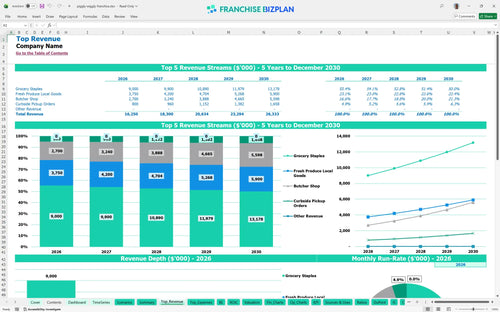
Revenue stream detailed view
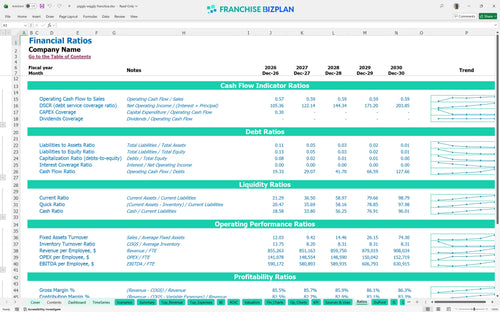
Performance metrics benchmark
We built this franchise unit profitability analysis using deep research into high-touch retail grocery operations. Key assumptions, including the $16.25 million year-one revenue and the 5% royalty fee, are pre-populated with researched data and are fully editable to match your specific location. This operational expense projection ensures you have a credible roadmap for managing everything from butcher shop equipment to curbside pickup logistics.
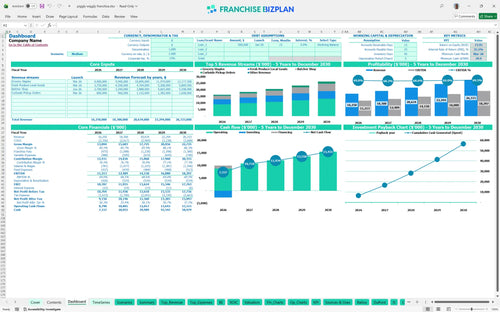
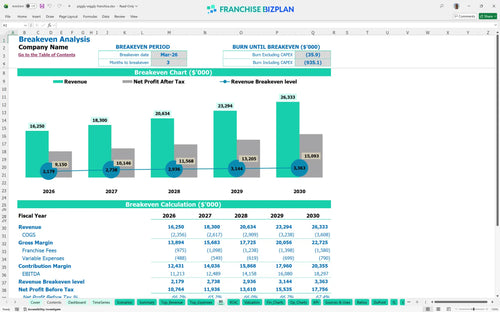
The unit is projected to reach its break-even point in March 2026, just three months after opening. With an initial EBITDA of $11.2 million in the first year, the model shows a strong upward trend as revenue grows from $16.2 million to over $26.3 million by year five.
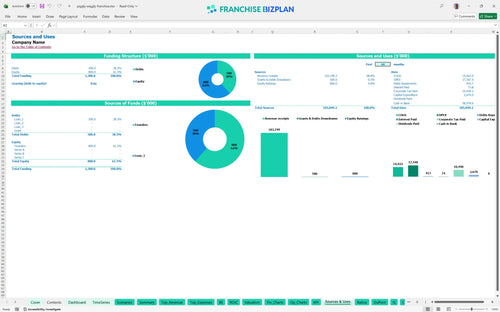
Launching this unit requires a total initial investment of $2,670,000, covering the $40,000 franchise fee and significant leasehold improvements. This detailed grocery store franchise startup budget also accounts for $350,000 in refrigeration and $450,000 in shelving to meet brand standards.
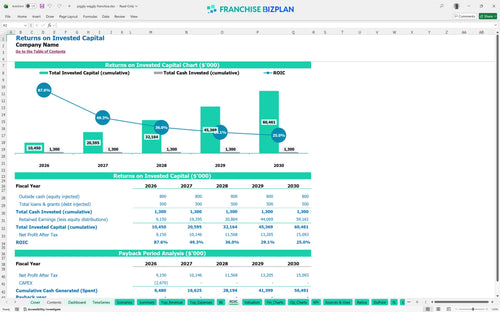
Investors can expect an Internal Rate of Return (IRR) of 35.48% and a Return on Equity (ROE) of 73.95% over the five-year period. While the return on investment calculation is strong, the full payback of the initial capital is estimated to occur after year five based on the current cash flow structure.
The break-even point analysis indicates that the store must cover $25,000 in monthly rent and approximately 6% in franchise-related fees. Calculating operating costs for a grocery franchise shows that hitting the March 2026 break-even date depends heavily on the $6 million in year-one grocery staple sales.
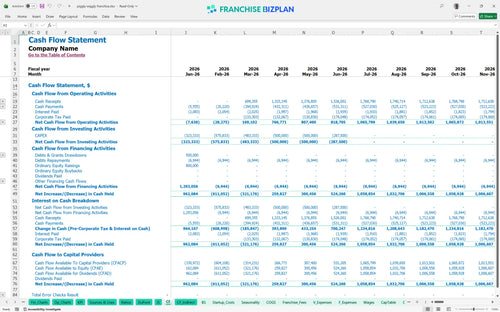
The lowest cash point occurs in March 2026 with a minimum balance of $30,000, requiring disciplined financial planning for new franchise owners. You will need enough working capital to bridge the gap between the $1.2 million build-out and the ramp-up of the butcher shop revenue stream.
This retail franchise profitability analysis spreadsheet allows you to toggle between Low, Medium, and High cases to see how a 10% drop in traffic affects your $11.2 million EBITDA. The High case assumes faster adoption of the curbside pickup orders, which start at $800,000 in year one and can significantly boost the bottom line.
This franchise financial model template is built in Excel to give you total control over your grocery store franchise investment. You can adjust every variable, from local labor rates to specific inventory costs, using pre-filled formulas that handle the heavy lifting of a retail franchise business plan. It is defintely the most flexible way to test different growth paths before signing a lease.

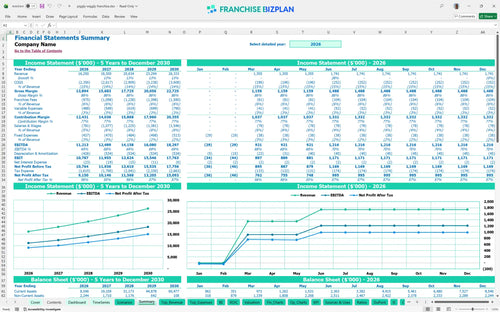
Plan for long-term growth with grocery store business plan financial projections that span sixty months of operation. This model tracks your journey from a $16.25 million year-one revenue base to over $26.3 million by year five, ensuring you can manage small business financial forecasting for franchises with precision. It maps out the transition from startup phase to a mature, high-volume retail entity.

This franchise unit economic model for retail stores captures every obligation to the franchisor, including the initial $40,000 fee and ongoing costs. By automating the franchise royalty fee structure, the model ensures you always know how much of your gross sales remains after the 5% royalty and 1% marketing fund contributions. This clarity is vital for maintaining store-level margins in a high-volume grocery environment.

Use the franchise startup cost calculator to estimate the total capital needed for leasehold improvements, refrigeration, and butcher shop equipment. The model provides a clear path on how to calculate franchise startup costs, showing you exactly when your monthly sales volume will cover both your $25,000 rent and variable expenses. Knowing your survival point helps you manage the early months of operation without running out of cash.

This grocery store franchise financial model template includes researched benchmarks for labor, occupancy, and inventory costs to keep your projections realistic. You can compare your $90,000 manager salary or 13% grocery COGS against industry standards to ensure your unit remains competitive. These guardrails help you avoid overly optimistic forecasts that could jeopardize your investment.


Simply purchase and download the financial model template, then access it instantly using Microsoft Excel or Google Sheets. No installation or technical expertise required-just open and start working.

Enter your business-specific numbers, including revenue projections, costs, and investment details. The pre-built formulas will automatically calculate financial insights, saving you time and effort.

Leverage the investor-ready format to confidently showcase your financial projections to banks, franchise representatives, or investors. Impress stakeholders with clear, data-driven insights and professional reports.

Leverage the investor-ready format to confidently present your projections to banks, franchise representatives, or investors.