
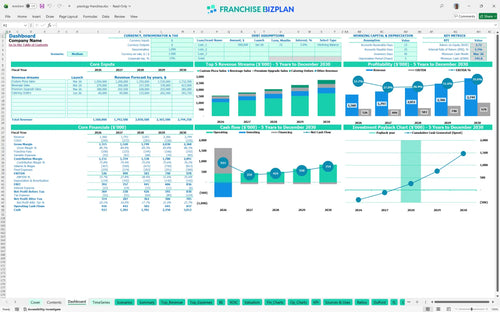
All-in-one Dashboard
Core inputs and core outputs


This financial projection spreadsheet for franchise owners provides a comprehensive toolkit for calculating labor and inventory costs for restaurant franchises, including detailed CAPEX schedules and five-year performance outlooks, ensuring everything you need to model a successful unit is right here.
Core inputs and core outputs
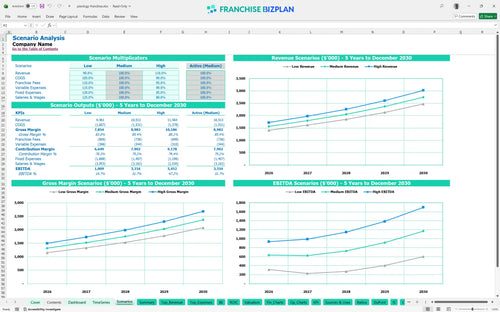
Three scenario analysis
Presentation ready
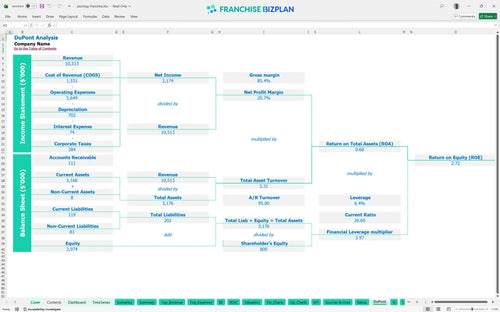
DuPont analysis
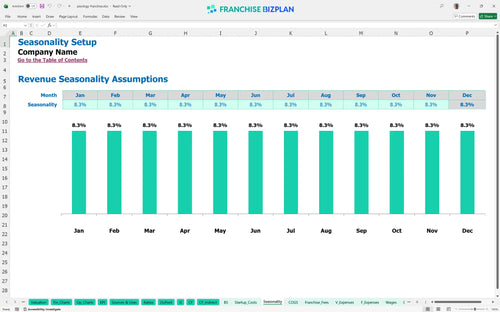
Researched revenue assumptions
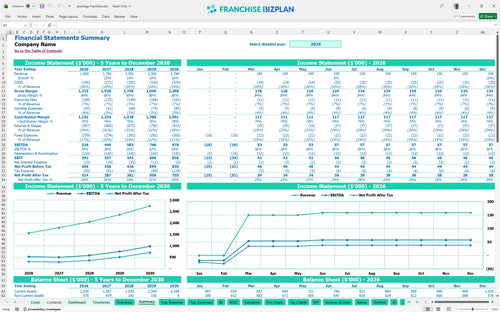
Lender-friendly financial outputs
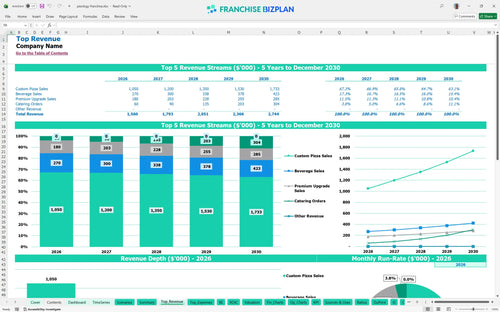
Revenue stream detailed view
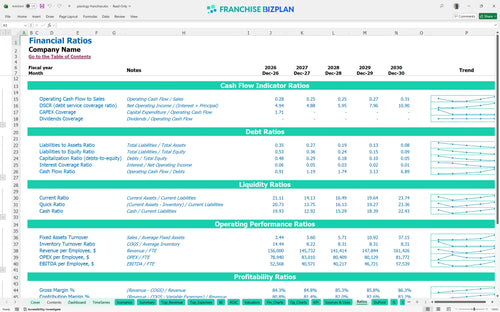
Performance metrics benchmark
We built this franchise unit financial model using our own research to provide a clear path for owners. Key assumptions like the $25,000 franchise fee and $526,000 year-one EBITDA are pre-populated with researched data specific to this custom pizza franchise unit and are fully editable. It is a practical tool for analyzing recurring revenue streams for food franchises. One-liner: Real-world data meets your specific business goals.
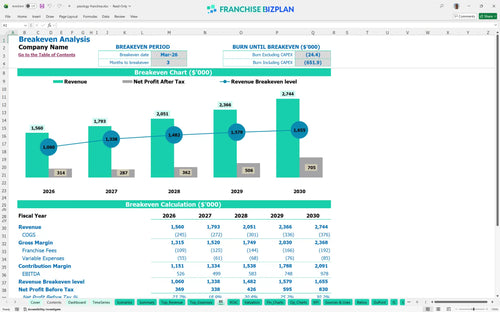
This unit reaches profitability quickly, with a break-even date of March 2026, just three months after launch. Year-one EBITDA (earnings before interest, taxes, depreciation, and amortization) is projected at $526,000, growing as catering orders scale from $60,000 to over $303,000 by year five. One-liner: Profitability starts when your catering and custom pizza sales align.
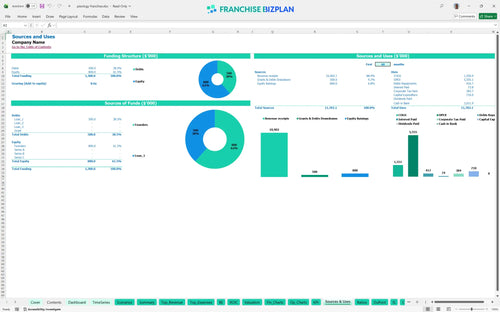
You will need a minimum cash position of $546,000 to launch this unit in the US. The model details restaurant franchise startup costs, covering the $350,000 build-out and $120,000 for specialized stone-fired ovens. One-liner: Your capital is your fuel, so spend it where it drives the most traffic.
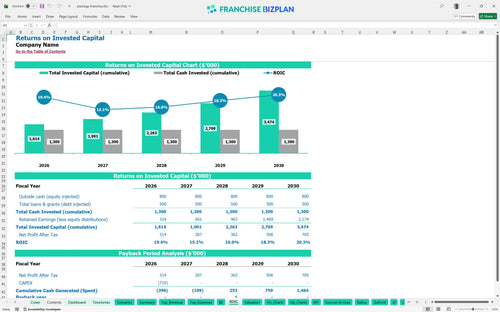
Investors can expect an Internal Rate of Return (IRR) of 5.49% and a Return on Equity (ROE) of 2.72. The payback period is approximately 3 years, which is standard for a high-volume fast-casual location in a prime development. One-liner: A three-year payback keeps your capital recycling for the next unit.
The unit hits its monthly break-even point in March 2026. Reaching this milestone depends heavily on maintaining custom pizza sales, which are forecasted to start at $700,000 annually, while managing the $16,000 monthly rent. One-liner: Your rent is fixed, so your volume must be fluid.
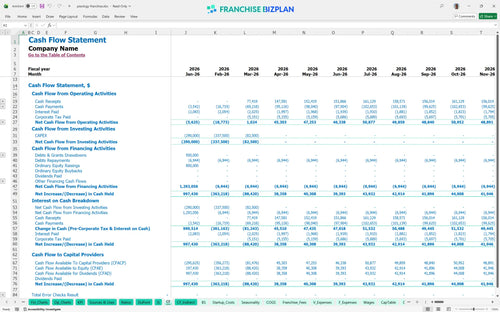
The lowest cash point occurs in March 2026 at $546,000. You need enough working capital to cover the initial three months of ramp-up before the unit becomes self-sustaining. This spreadsheet template for restaurant franchise cash flow projections helps you in creating a budget for a new franchise unit. One-liner: Cash runway is your safety net during the grand opening.
Comparing scenarios shows how revenue grows from $1.56M to $2.74M, significantly shifting your store-level margin and peak cash needs. The model allows you to stress-test essential financial metrics for new franchise locations and is perfect for estimating profitability for fast-casual restaurants. One-liner: Plan for the worst, but execute for the high-growth scenario. Finance: update unit break-even and payback model by Friday.
This franchise financial model template is fully customizable in Excel, featuring pre-filled formulas and editable assumptions. You can defintely adjust the food franchise investment analysis to fit your specific territory or real estate costs. It is built to handle the unique unit economics of a high-volume pizza shop, so you can test every variable. One-liner: You control the numbers, the numbers don't control you.

Map out your growth with a detailed franchise business plan Excel that projeckts five years of performance. It tracks revenue from $1.56M in year one up to $2.74M by year five, ensuring you see the full picture of fast casual franchise profitability. Plus, it helps you visualize the long-term ROI calculation as your market matures. One-liner: See your five-year future before you sign the lease.

The model captures essential franchise royalty fees and brand fund contributions to show true store-level margin. With a 5% royalty and 2% marketing fee, you can see exactly how these recurring costs impact your bottom line. Honestly, understanding these fees is the only way to protect your net income. One-liner: Know your royalties before they hit your bank account.

Use this tool to calculate startup costs for a pizza franchise, including leasehold improvements of $350,000 and stone-fired ovens at $120,000. The break-even analysis identifies the exact sales volume needed to cover your $16,000 monthly rent. It is a vital part of any franchise investment feasibility study template, but it remains easy to use. One-liner: Find your zero-profit point to start making real money.

We include built-in benchmarks to help you evaluate franchise financial performance indicators against industry standards. Comparing your food ingredients cost-starting at 13.5%-against typical fast-casual ranges ensures your unit economics stay competitive. Still, you can tweak these to match your local supplier pricing. One-liner: Compare your store to the best in the business.


Simply purchase and download the financial model template, then access it instantly using Microsoft Excel or Google Sheets. No installation or technical expertise required-just open and start working.

Enter your business-specific numbers, including revenue projections, costs, and investment details. The pre-built formulas will automatically calculate financial insights, saving you time and effort.

Leverage the investor-ready format to confidently showcase your financial projections to banks, franchise representatives, or investors. Impress stakeholders with clear, data-driven insights and professional reports.

Leverage the investor-ready format to confidently present your projections to banks, franchise representatives, or investors.