
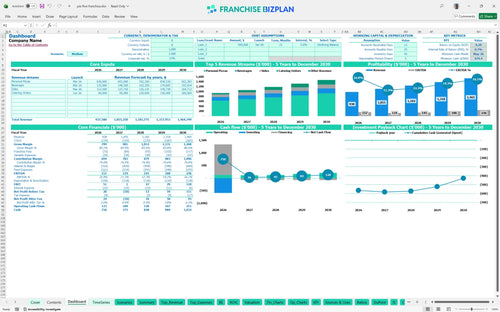
All-in-one Dashboard
Core inputs and core outputs


This franchise unit business plan includes a complete Excel template for franchise unit financial projections, featuring a 5-year P&L, startup cost tracker, and automated cash flow statements.
Core inputs and core outputs
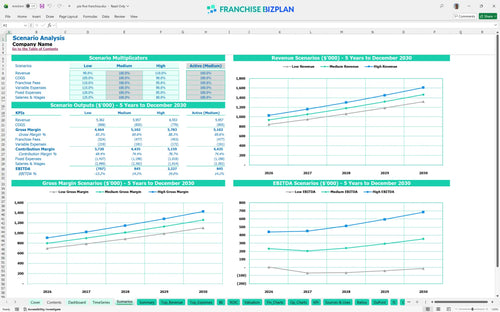
Three scenario analysis
Presentation ready
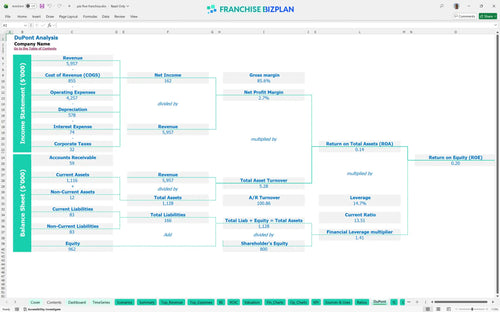
DuPont analysis
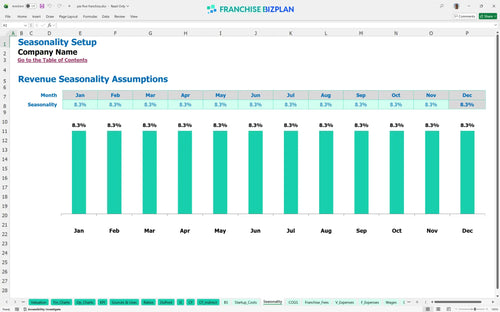
Researched revenue assumptions
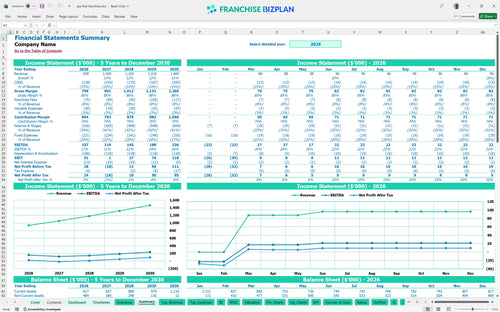
Lender-friendly financial outputs
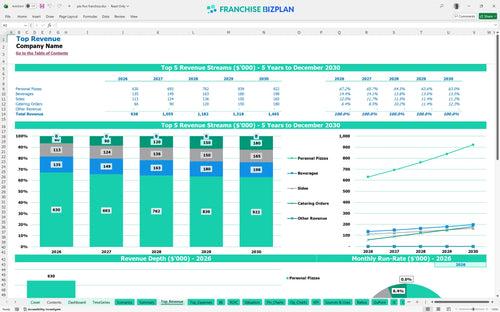
Revenue stream detailed view
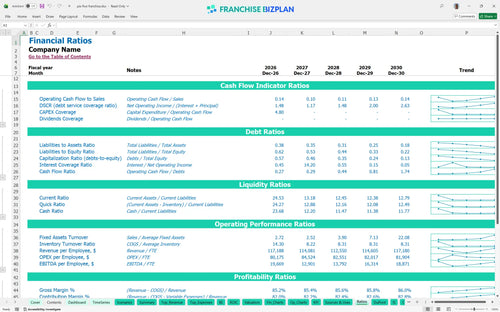
Performance metrics benchmark
We developed this fast-casual restaurant financial template using detailed research on unit-level economics and startup requirements. The model comes pre-populated with researched data, such as the $14,000 monthly rent and $938,000 year-one revenue target, but every field remains fully editable to match your specific territory. It is a practical tool for any operator looking to move from a rough estimate to a data-driven execution plan.
The unit is projected to reach monthly profitability by April 2026, just four months after opening its doors. This pizza restaurant franchise profit margin analysis shows EBITDA growing from $157,000 in year one to $236,000 by year five as the unit economics stabilize and catering revenue scales.
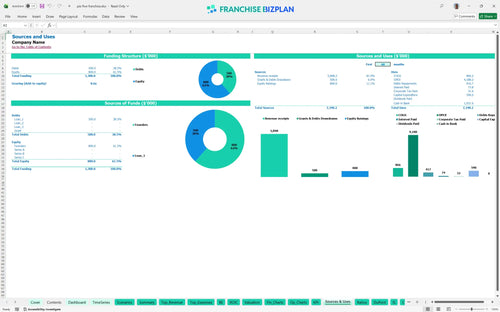
Launching this unit requires a total initial investment of approximately $590,000, covering the franchise fee, build-out, and high-speed ovens. When budgeting for a new pizza restaurant franchise, you must also account for the $674,000 minimum cash needed to handle the ramp-up phase through May 2026.
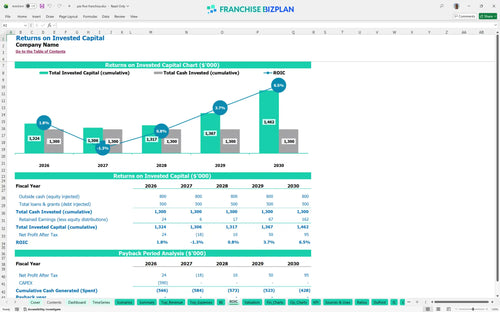
This restaurant franchise investment feasibility study indicates an internal rate of return (IRR) of 0.71 and a return on equity (ROE) of 0.2. While the high initial CAPEX means full payback occurs after year five, the consistent growth in annual unit volume provides a strong return on investment for long-term operators.
Calculating break-even point for franchise units shows that this location needs to hit its stride by month four to cover the $14,000 monthly rent and fixed staffing costs. The primary driver for reaching this point is the daily volume of personal pizzas, which accounts for nearly half of the projected year-one revenue.
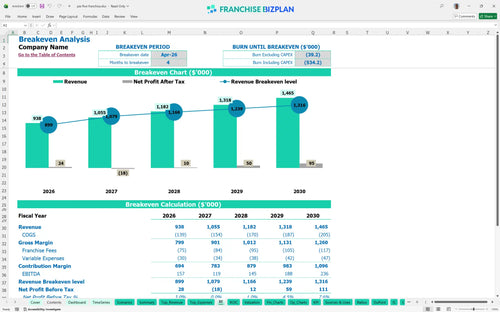
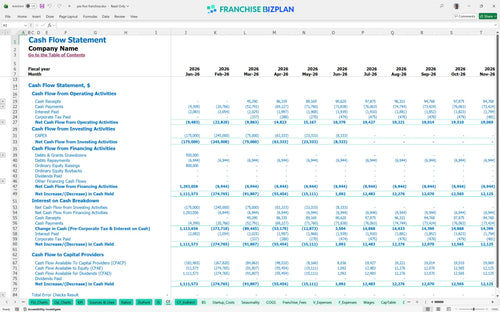
The lowest cash point occurs in May 2026, meaning you need a solid runway to get through the first few months of operations. This franchise unit P&L statement template suggests that having a cash buffer is defintely necessary to manage the gap between your initial equipment payments and the ramp-up in catering sales.
This financial model for fast-casual restaurant franchise allows you to toggle between low, medium, and high cases to see how a 10% change in traffic impacts your bottom line. In the high-case scenario, aggressive local marketing and high guest retention can push year-five revenue toward $1.46M, significantly improving the overall valuation.
Finance: update unit break-even and payback model by Friday
This franchise financial model is built in Excel with fully editable assumptions, allowing you to adjust everything from dough costs to hourly wages. The pre-filled formulas handle the heavy lifting so you can focus on testing different revenue scenarios and site-specific expenses without needing to be a spreadsheet expert.

Success in the pizza industry requires a long-term view of how your margins shift as you scale from opening day to a mature operation. This tool provides detailed 5-year projections for revenue and cash flow, making it easier to perform financial forecasting for food service franchises and plan for future multi-unit expansion.

Operating a branded unit means managing specific financial obligations like the 6% royalty and 2% marketing fund contributions. This model tracks these franchise royalty fees automatically against your sales, so you always know exactly how much is leaving the store before you pay your local bills.

When you are looking at how to calculate startup costs for a pizza franchise, you need to account for everything from the $50,000 franchise fee to the $250,000 leasehold improvements. This analysis maps your startup capital requirements against your operational overhead to find the exact sales volume needed to cover your monthly nut.

We include fast-casual sector benchmarks to help you sanity-check your projections against real-world performance. This makes estimating operating expenses for a new franchise location much simpler, as you can compare your labor and rent ratios to industry standards to ensure a competitive franchise profitability analysis.


Simply purchase and download the financial model template, then access it instantly using Microsoft Excel or Google Sheets. No installation or technical expertise required-just open and start working.

Enter your business-specific numbers, including revenue projections, costs, and investment details. The pre-built formulas will automatically calculate financial insights, saving you time and effort.

Leverage the investor-ready format to confidently showcase your financial projections to banks, franchise representatives, or investors. Impress stakeholders with clear, data-driven insights and professional reports.

Leverage the investor-ready format to confidently present your projections to banks, franchise representatives, or investors.