
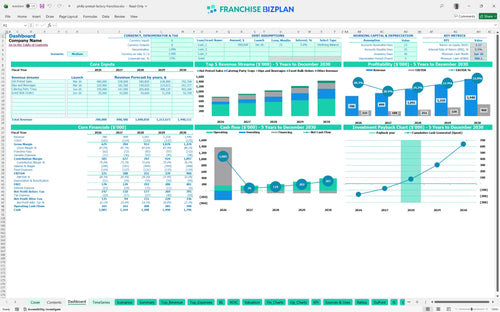
All-in-one Dashboard
Core inputs and core outputs


This comprehensive Excel template provides a dynamic 5-year outlook for a retail food unit, integrating revenue drivers, payroll, and capital expenditure into a professional-grade investment analysis.
Core inputs and core outputs
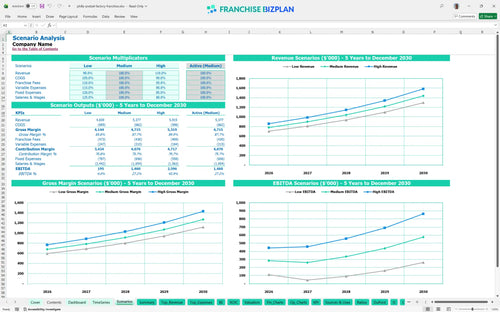
Three scenario analysis
Presentation ready
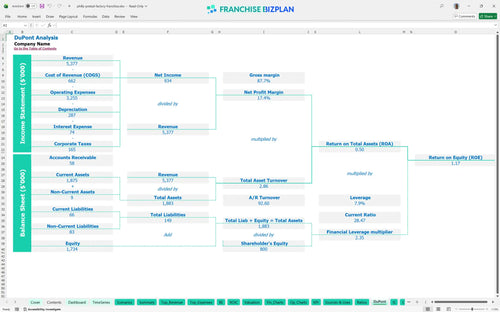
DuPont analysis
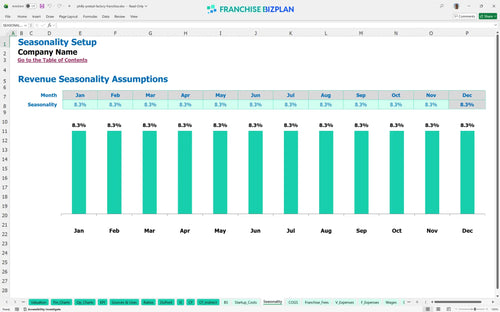
Researched revenue assumptions
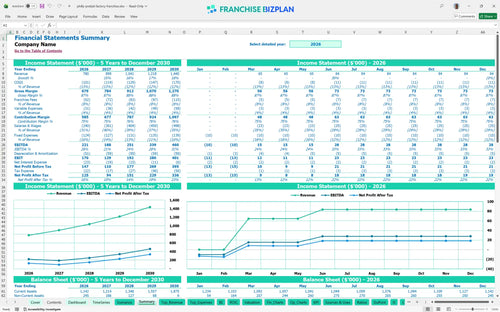
Lender-friendly financial outputs
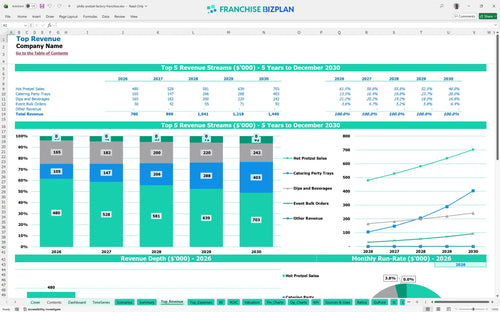
Revenue stream detailed view
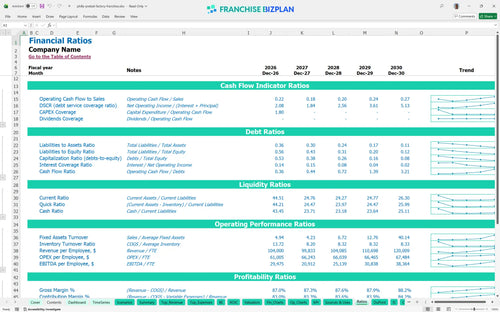
Performance metrics benchmark
We built this franchise unit financial model using extensive research to ensure your projections are grounded in reality. Key assumptions like your $780,000 year-one revenue and 6% royalty fees are pre-populated but fully editable to match your specific location. This guide helps you estimate profitability for food retail franchises by mapping out everything from your $120,000 build-out to your $58,000 manager salary.
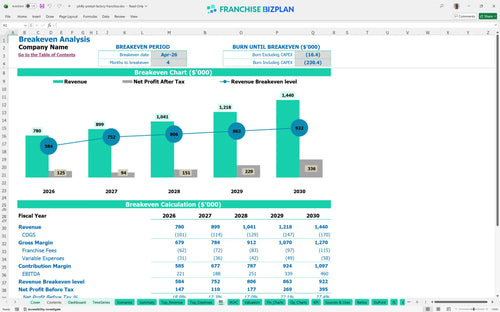
Based on the data, this unit hits its break-even point in April 2026, just four months after launching. With year-one EBITDA starting at $221,000 and climbing to $460,000 by year five, the profitability trajectory is strong if you manage the 11% ingredient costs tightly.
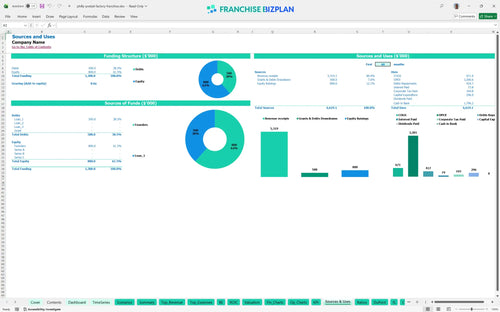
Launching this unit requires a significant upfront commitment, including a $35,000 franchise fee and $120,000 for leasehold improvements. Your total capital expenditure covers everything from $65,000 baking ovens to $12,000 in signage, ensuring the facility meets brand standards before the first pretzel is twisted.
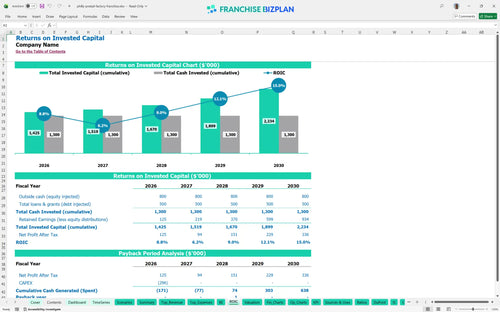
The model shows an Internal Rate of Return (IRR) of 5.47% and a Return on Equity (ROE) of 1.17. You can expect a 3-year payback period, which is quite competitive for a retail food franchise investment analysis when considering the steady ramp-up in revenue.
You need to hit your break-even sales volume by month four to stay on track with the $986,000 minimum cash projection. The biggest pressure on your break-even point is the fixed $7,500 monthly rent and the 8% combined royalty and marketing burden.
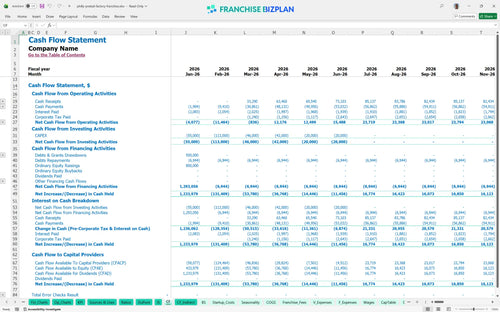
Your lowest cash point is expected in June 2026, roughly $986,000, which includes your initial investment and early operating losses. You defintely need to maintain a buffer to handle the ramp-up of the B2B sales coordinator, who starts at a $42,000 salary in June to drive catering volume.
The model compares outcomes where revenue might fluctuate by 10-20% based on local demand. In a high-growth scenario, year-one revenue of $780,000 could jump significantly if event bulk orders exceed the $30,000 estimate, accelerating your ROI analysis and shortening the 3-year payback.
This franchise financial model is a flexible Excel tool designed for real-world operators. You can swap out pre-filled assumptions for your specific territory, adjusting everything from local labor rates to rent. It handles the heavy lifting of math so you can focus on whether the unit economics actually pencil out for your market.

Mapping out a five-year horizon is critical for understanding when you move from survival to scaling. This model projects annual revenue from $780,000 in year one up to $1.44M by year five, accounting for growth in catering and retail traffic. It provides a clear view of cash flow and net profit, helping you spot potential capital crunches before they happen.

Royalties and brand funds are non-negotiable top-line haircuts that directly impact your take-home pay. This tool tracks the 6% royalty and 2% marketing fee against your gross sales, ensuring you see the true net margin after the franchisor gets their cut. By baking in the initial $35,000 franchise fee, the model shows the full impact of these costs on your total investment.

Getting the doors open requires more than just a dream; it takes a precise breakdown of leaseholds, ovens, and signage. This franchise business plan template calculates exactly how much revenue you need each month to cover your $7,500 rent and other fixed costs. Knowing your break-even point helps you set realistic daily sales targets for your team from day one.

Don't guess if your 11% flour cost is efficient; use the built-in benchmarks to verify your performance. The model includes typical ranges for labor and COGS (cost of goods sold), allowing you to sanity-check your projections against industry standards. If your margins look too good to be true, the tool helps you identify where your assumptions might be overly optimistic.


Simply purchase and download the financial model template, then access it instantly using Microsoft Excel or Google Sheets. No installation or technical expertise required-just open and start working.

Enter your business-specific numbers, including revenue projections, costs, and investment details. The pre-built formulas will automatically calculate financial insights, saving you time and effort.

Leverage the investor-ready format to confidently showcase your financial projections to banks, franchise representatives, or investors. Impress stakeholders with clear, data-driven insights and professional reports.

Leverage the investor-ready format to confidently present your projections to banks, franchise representatives, or investors.