
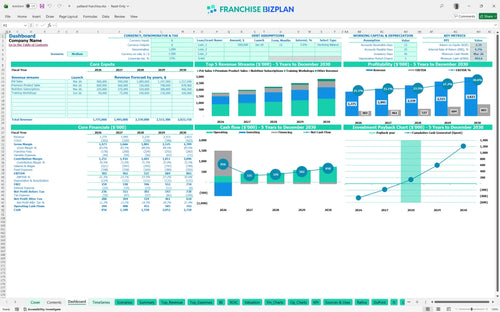
All-in-one Dashboard
Core inputs and core outputs


This pet store financial projection model includes everything from animal acquisition costs and premium product inventory to detailed payroll and five-year EBITDA growth targets. This model covers everything from puppy sales to payroll taxes.
Core inputs and core outputs
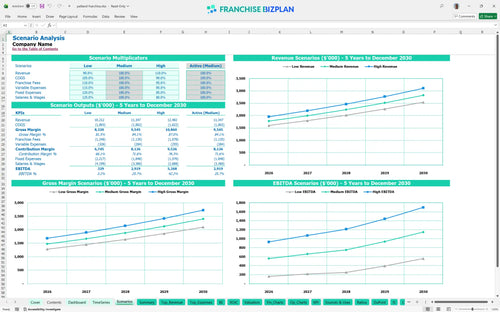
Three scenario analysis
Presentation ready
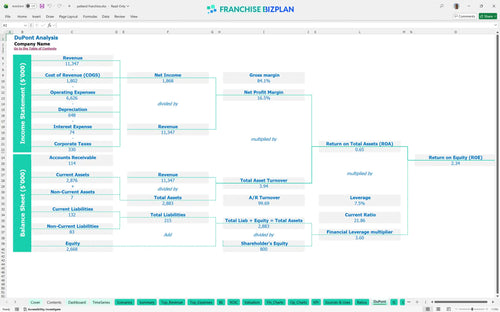
DuPont analysis
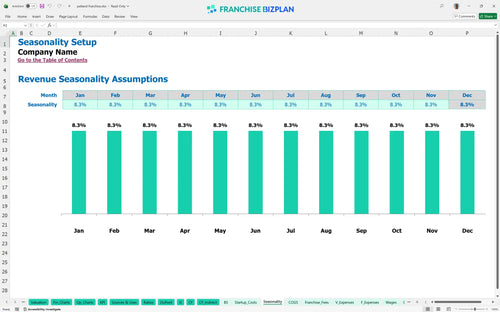
Researched revenue assumptions
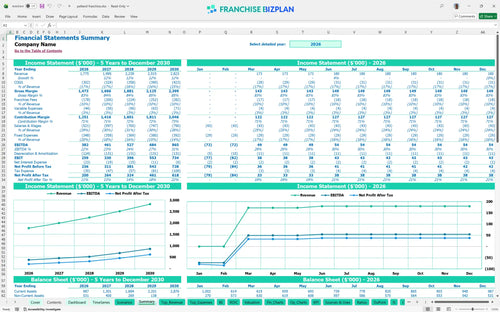
Lender-friendly financial outputs
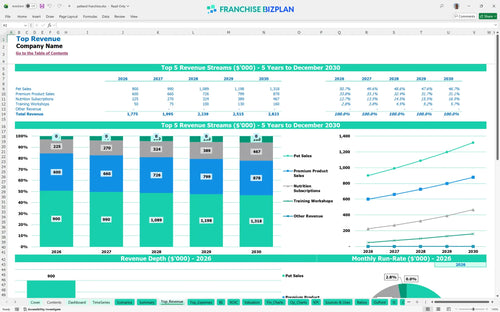
Revenue stream detailed view
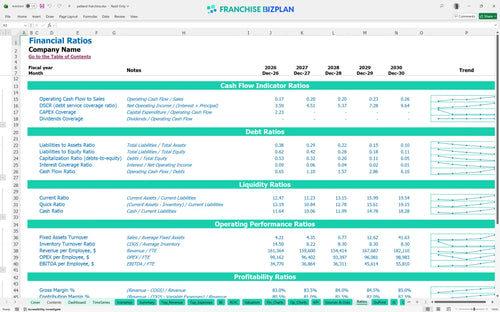
Performance metrics benchmark
We built this franchise unit financial model using our own research to provide a realistic roadmap for your new location. Key assumptions, including the $1.77M year-one revenue target and the $382,000 initial EBITDA, are pre-populated and fully editable to match your local market conditions.
The unit hits an EBITDA of $382,000 in its first year and scales to $865,000 by year five as revenue grows. This franchise unit profitability analysis shows that while animal sales drive the volume, the nutrition subscriptions and training workshops provide the high-margin stability neccessary for long-term growth. Profitability is about more than just selling pets; it is about managing the margins on every bag of food.
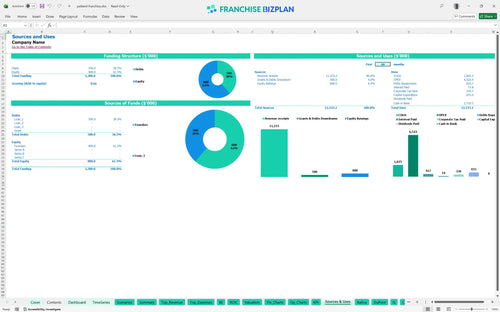
To launch this unit in the US, you need to know how to calculate startup costs for a pet franchise, which total roughly $655,000 in capital expenditures plus a $493,000 cash buffer. The largest outlays are for leasehold improvements and specialized animal enclosures, which are critical for meeting brand standards. You need over a million dollars to get this off the ground properly.
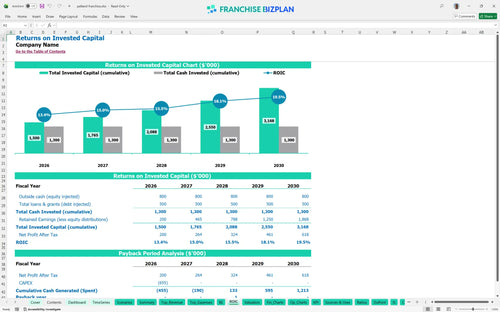
Based on the projected cash flows, you can expect a 4.74% internal rate of return and a 2.34 return on equity. The model shows a payback period of 3 years, which is a standard timeline for a high-traffic retail operation with significant build-out costs. A three-year payback is a solid result for a high-touch retail play to determine the franchise investment ROI.
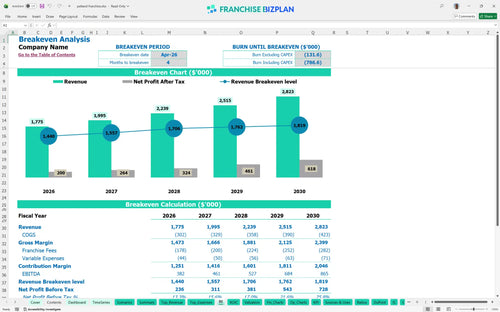
The unit is projected to reach its break-even point in April 2026, just four months after launching. The biggest hurdles to reaching this point are the $20,000 monthly rent and the $37,500 monthly labor cost, so hitting your sales targets early is vital in this financial model template for retail franchise units. Hitting break-even in month four requires a fast start in your local market.
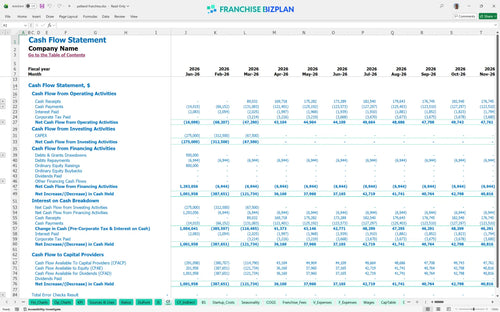
The lowest cash point occurs in March 2026 at $493,000, which means you defintely need a strong capital reserve to handle the pre-opening and ramp-up phases. Using a franchise unit cash flow forecasting spreadsheet helps you see exactly when the cash starts to replenish after the initial inventory and build-out spend. Cash is oxygen, and March 2026 is when the air gets thinnest.
Comparing Low, Medium, and High scenarios shows that even a 10% dip in revenue can delay your payback period by over a year. Analyzing profit margins for pet supply and animal retail under different conditions helps you prepare for fluctuations in local demand or rising supply costs. The high case is only possible if your team executes the training workshops perfectly.
This pet store franchise financial model is fully customizable in Excel, featuring pre-filled formulas and editable assumptions that make it easy to adapt to your specific territory. You can swap out the pre-populated data for your own local rent, labor rates, and supply costs to see how the bottom line shifts. It is basically a plug-and-play tool for your store math.

Long-term planning is essential for any retail business financial forecasting, and this model provides a detailed 5-year view of your revenue, costs, and cash flow. By mapping out growth from $1.77M in year one to over $2.8M by year five, you can plan for future staffing needs and equipment upgrades well in advance. Five years of foresight helps you dodge common retail traps.

The model captures specific financial obligations like the 4.5% royalty and 5.5% marketing fund contributions, which are vital for estimating recurring revenue for pet retail businesses. These off-the-top costs significantly impact your store-level margin, so we built them directly into the monthly cash flow logic. The franchisor takes their cut off the top, so you better know the net.

Planning your initial investment is easier with a dedicated franchise unit break-even analysis that tracks every dollar from the $40,000 franchise fee to the $300,000 leasehold improvements. This tool helps you pinpoint the exact sales volume needed to cover your $20,000 monthly rent and other fixed overhead. Knowing your break-even number keeps the doors open during slow months.

We have included built-in benchmarks for essential financial metrics for pet store owners, allowing you to sanity-check your animal acquisition costs and labor percentages. If your projected margins fall outside typical industry ranges, the model highlights the gap so you can adjust your pricing or staffing plan. Comparing your numbers to the pack keeps your expectations honest.


Simply purchase and download the financial model template, then access it instantly using Microsoft Excel or Google Sheets. No installation or technical expertise required-just open and start working.

Enter your business-specific numbers, including revenue projections, costs, and investment details. The pre-built formulas will automatically calculate financial insights, saving you time and effort.

Leverage the investor-ready format to confidently showcase your financial projections to banks, franchise representatives, or investors. Impress stakeholders with clear, data-driven insights and professional reports.

Leverage the investor-ready format to confidently present your projections to banks, franchise representatives, or investors.