
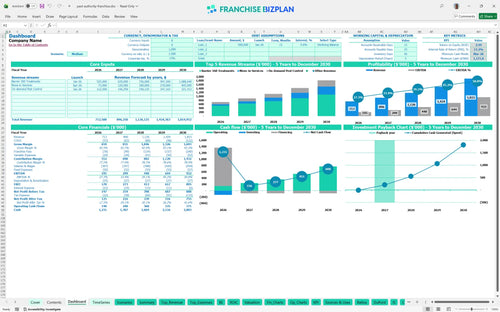
All-in-one Dashboard
Core inputs and core outputs


This franchise unit financial plan provides a comprehensive roadmap for managing capital, labor, and recurring revenue in a mobile pest control operation.
Core inputs and core outputs
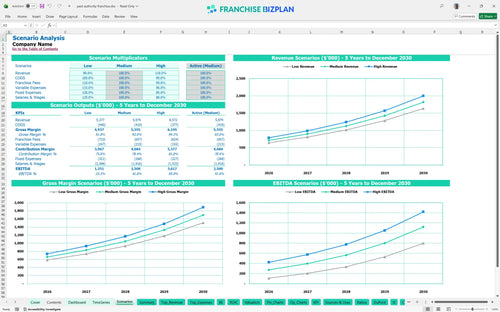
Three scenario analysis
Presentation ready
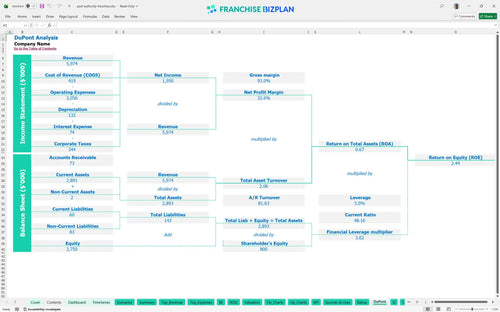
DuPont analysis
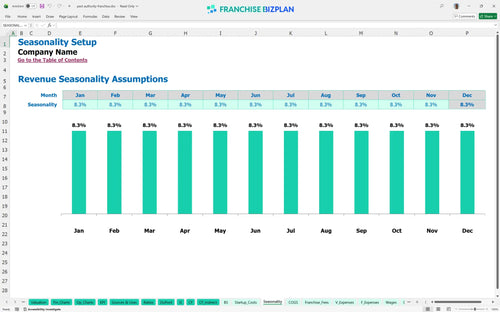
Researched revenue assumptions
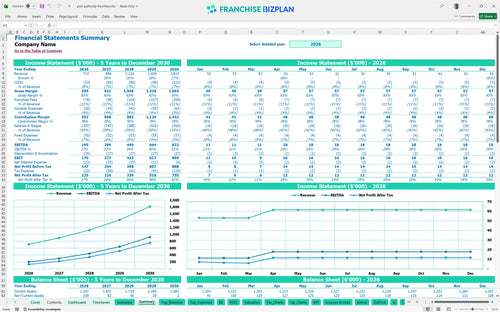
Lender-friendly financial outputs
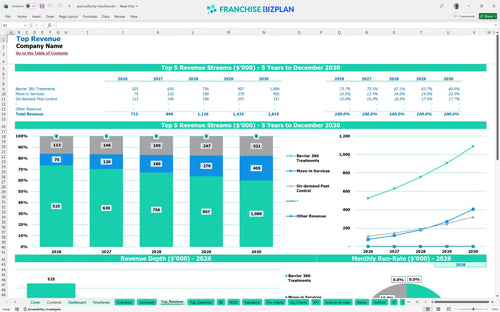
Revenue stream detailed view
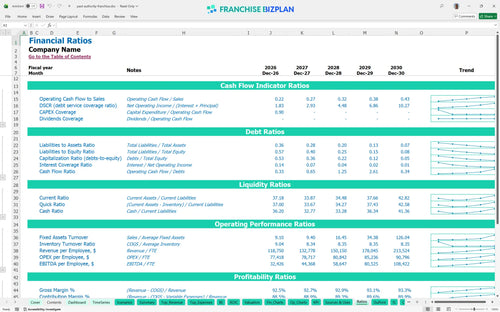
Performance metrics benchmark
We developed this pest control business profit and loss template based on deep dive research into the unit economics of mobile service brands. The pre-populated data includes critical metrics like a $195,000 Year 1 EBITDA and a 2-year payback period, all of which are fully editable to reflect your specific market conditions.
This franchise unit hits profitability almost immediately, with a projected breakeven in January 2026, just one month after launch. By Year 1, you are looking at $195,000 in EBITDA after accounting for the 11% combined royalty and marketing fees and chemical costs.
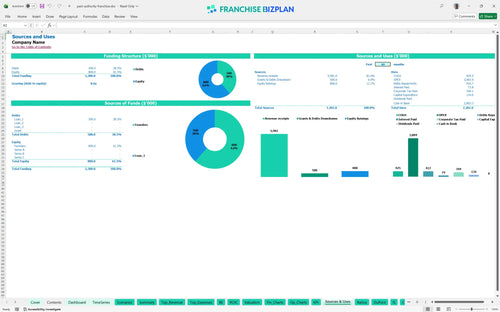
You will need approximately $134,000 in initial capital to cover the franchise fee, branded vehicles, and equipment setup. This financial model for new franchise unit investment ensures you have enough runway to handle the $1,172 minimum cash requirement seen in early 2026.
Investors can expect an Internal Rate of Return (IRR) of 13.23% and a Return on Equity (ROE) of 2.44 over the initial five-year period. With a 2-year payback period, the model shows a fast recovery of the initial $134,000 investment compared to traditional brick-and-mortar concepts.
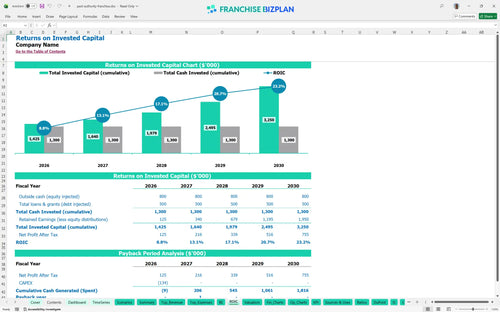
The unit reaches break-even in its first month of operation due to the low fixed overhead of $4,000 per month. Evaluating pest control franchise investment feasibility shows that technician labor and fuel costs are the primary drivers that will shift this point as you scale your fleet.
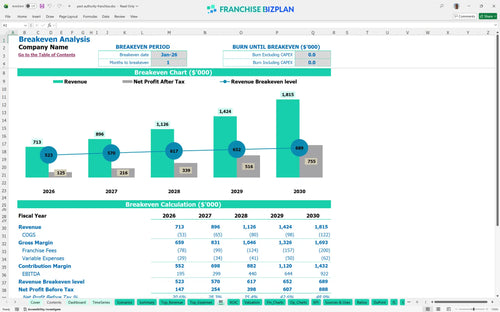
The lowest cash point occurs in March 2026, with a minimum cash balance of $1,172 projected. Financial planning for mobile service franchise units requires keeping a tight grip on technician hiring during the first 90 days to ensure the ramp-up in revenue stays ahead of payroll.
Moving from a Medium to a High scenario, where Year 1 revenue exceeds $713,000, significantly boosts your Year 5 EBITDA beyond the projected $922,000. The model allows you to stress-test how a 10% increase in chemical costs or a dip in Barrier 360 retention affects your 13.23% IRR.
Finance: update unit break-even and payback model by Friday.
This Excel-based tool allows you to swap out every variable, from technician headcount to chemical costs, ensuring your projections match your specific territory. You can adjust revenue drivers like Barrier 360 treatment volume or move-in service frequency to see how local demand impacts your bottom line.

Planning for a five-year horizon is essential for a mobile service franchise where fleet scaling and technician retention drive long-term value. This model tracks your path from a $713,000 Year 1 revenue base to a mature $1.8 million operation by Year 5, accounting for rising labor needs and vehicle maintenance.

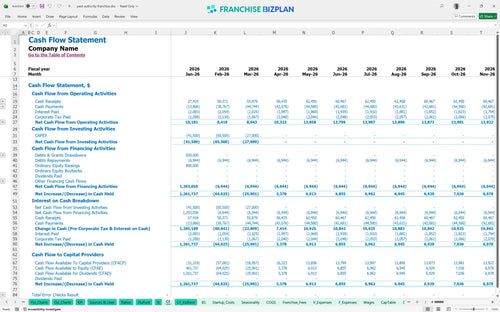
Operational success depends on understanding exactly how much cash leaves the business before you pay your own bills. The model calculates the 8% royalty and 3% marketing fund contributions against your monthly sales, ensuring you see the impact of these fees on your store-level margin.

You need to know exactly when your cash flow turns positive to manage your working capital effectively. By aggregating your $25,000 franchise fee, $55,000 vehicle investment, and initial $9,000 inventory, this model identifies the exact sales volume required to cover your fixed monthly overhead of roughly $4,000.

Comparing your local estimates against industry standards prevents unrealistic expectations that can sink a new territory. The model includes benchmarks for chemical costs-starting at 6% of revenue-and fuel expenses to help you defintely verify if your operating margins are competitive for a home service model.


Simply purchase and download the financial model template, then access it instantly using Microsoft Excel or Google Sheets. No installation or technical expertise required-just open and start working.

Enter your business-specific numbers, including revenue projections, costs, and investment details. The pre-built formulas will automatically calculate financial insights, saving you time and effort.

Leverage the investor-ready format to confidently showcase your financial projections to banks, franchise representatives, or investors. Impress stakeholders with clear, data-driven insights and professional reports.

Leverage the investor-ready format to confidently present your projections to banks, franchise representatives, or investors.