
All-in-one Dashboard
Core inputs and core outputs


This restaurant and bakery unit financial projections package includes a franchise investment calculator and detailed schedules for CAPEX, labor, and multi-channel revenue streams.
Core inputs and core outputs
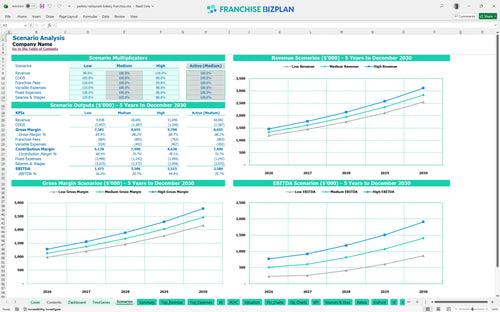
Three scenario analysis
Presentation ready
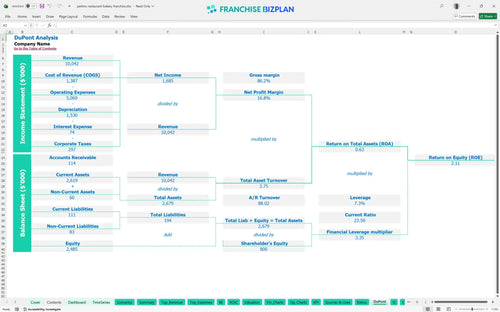
DuPont analysis
Researched revenue assumptions
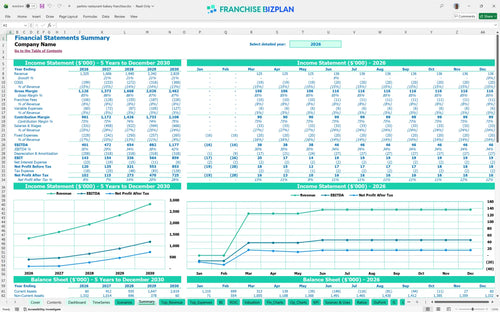
Lender-friendly financial outputs
Revenue stream detailed view
Performance metrics benchmark
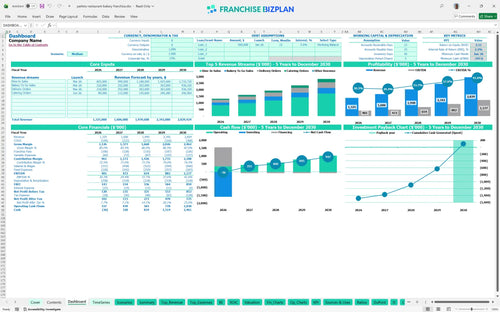
We developed this franchise investment feasibility study template using detailed research on dual-service dining and bakery models. The pre-populated assumptions cover everything from $14,000 monthly rent to a $401,000 first-year EBITDA, providing a transparent look at the unit's potential. Every number is fully editable to match your specific territory and local market conditions.
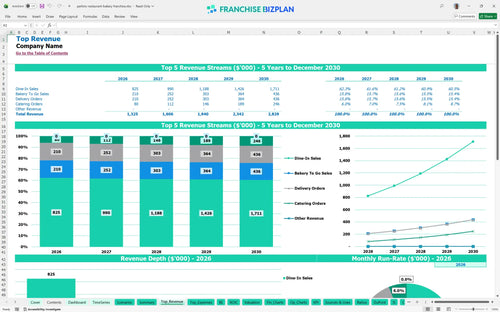
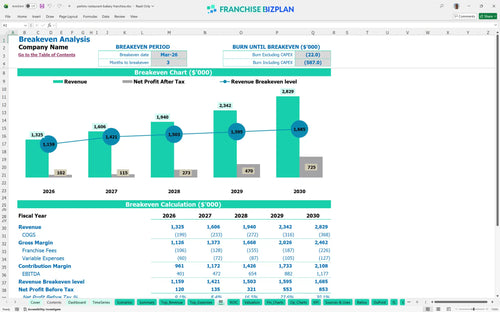
The unit reaches its break-even date in March 2026, just three months after opening. To understand how to forecast revenue for a new franchise location, the model tracks four streams, including dine-in and bakery-to-go, to drive a year-one revenue of $1.32M.
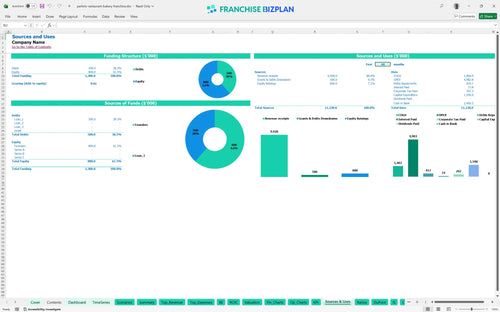
Total capital requirements exceed $1.59M, driven heavily by the $750,000 leasehold improvement budget and $480,000 for combined kitchen and bakery equipment. This capital expenditure budget also includes a $40,000 franchise fee and accounts for a $248,000 minimum cash floor during the ramp-up phase.
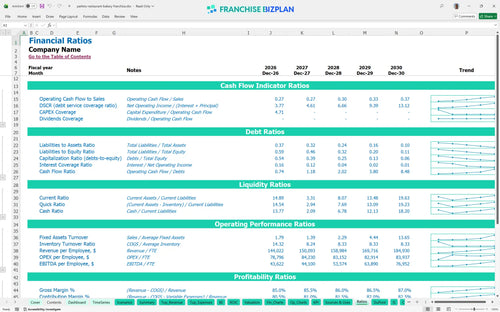
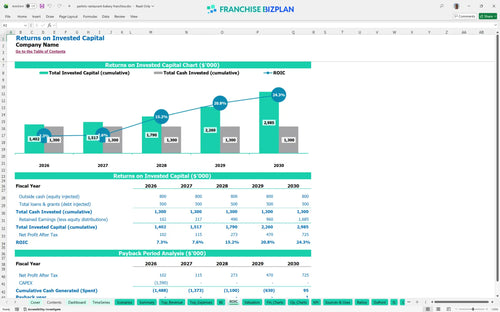
The ROI analysis shows a 5-year payback period with an internal rate of return (IRR) of 2.24%. While the initial return on equity is 2.11, the unit's value grows as EBITDA scales from $401,000 in year one to over $1.17M by year five.
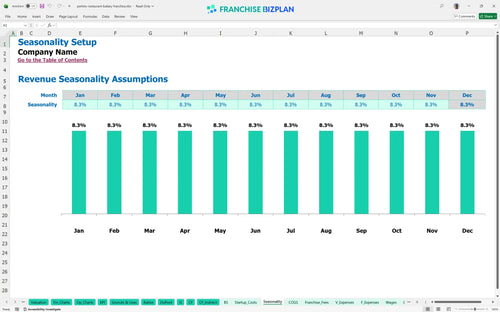
Monthly break-even depends on maintaining a high average ticket across the dine-in and delivery channels to cover $14,000 in monthly rent. Estimating operating expenses for a retail bakery is key here, as the 8% royalty and marketing fee requires consistent volume to clear fixed costs.
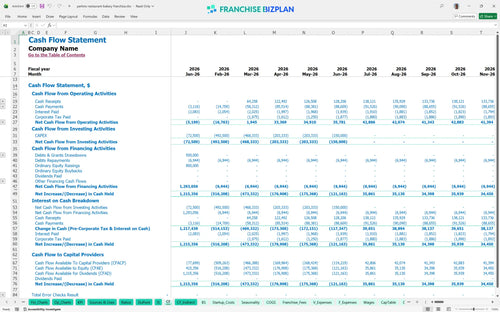
Your lowest cash point hits -$248,000 in June 2026, so financial planning for restaurant and bakery business requires a significant liquidity buffer. You'll need enough runway to cover the $130,000 furniture investment and the initial months of $20,000+ in management salaries before cash flow turns positive.
Analyzing profitability for dual-service restaurant models shows that a high-performance scenario, reaching $2.8M in revenue by year five, dramatically improves the IRR. Even in a low scenario, the 10.5% food cost target in later years helps protect the bottom line and improves the year-1 margin defintely.
Finance: update unit break-even and payback model by Friday.
This financial model template for new franchise owners is built in Excel, allowing you to adjust every assumption from hourly wages to local ingredient costs. The restaurant franchise financial model uses pre-filled formulas that update instantly, so you can test different site selections or staffing levels without breaking the math.

A solid bakery franchise business plan requires a long-term view of cash flow and growth. This model provides 5-year revenue forecasting and a restaurant cash flow projection spreadsheet that tracks your journey from a $1.3M opening year to a $2.8M mature operation.

Understanding royalty and franchise fee structures is essential to protect your store-level margin. This tool automatically calculates the 4% royalty and 4% marketing fund contributions against your operational expenses, ensuring you see the true net profit after all brand obligations are met.

Knowing how to calculate startup costs for a restaurant franchise is the first step to securing funding. This franchise startup cost template details the $1.59M initial investment, mapping out everything from the $40,000 franchise fee to the $750,000 build-out, so you know exactly when you'll stop burning cash.

We use restaurant profitability analysis and real-world unit economics to help you sanity-check your numbers. The model includes benchmarks for food COGS, which we project starting at 12.5%, and labor costs, helping you stay competitive while maintaining high service standards.


Simply purchase and download the financial model template, then access it instantly using Microsoft Excel or Google Sheets. No installation or technical expertise required-just open and start working.

Enter your business-specific numbers, including revenue projections, costs, and investment details. The pre-built formulas will automatically calculate financial insights, saving you time and effort.

Leverage the investor-ready format to confidently showcase your financial projections to banks, franchise representatives, or investors. Impress stakeholders with clear, data-driven insights and professional reports.

Leverage the investor-ready format to confidently present your projections to banks, franchise representatives, or investors.