
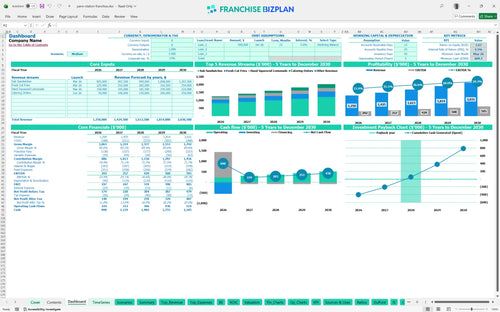
All-in-one Dashboard
Core inputs and core outputs


This product includes a comprehensive restaurant franchise profit and loss statement template, dynamic cash flow trackers, and automated CAPEX tables for immediate business analysis.
Core inputs and core outputs
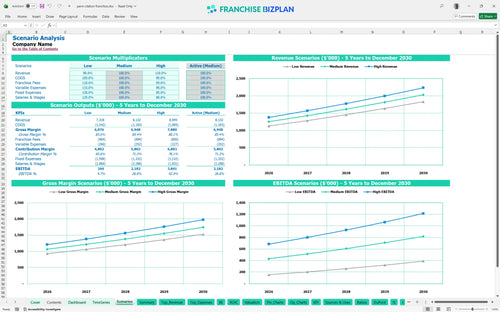
Three scenario analysis
Presentation ready
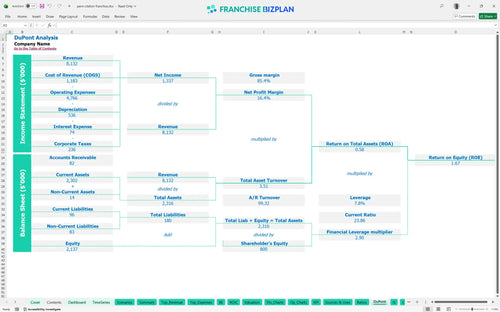
DuPont analysis
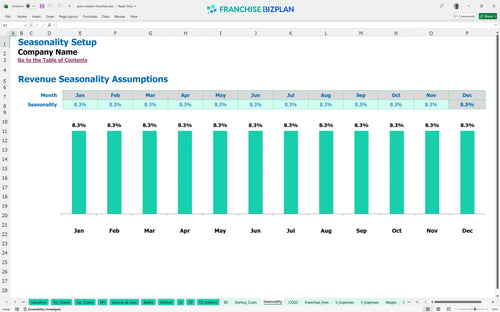
Researched revenue assumptions
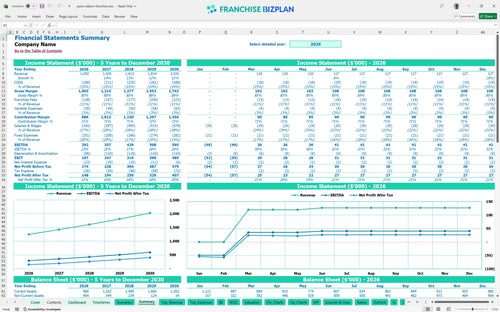
Lender-friendly financial outputs
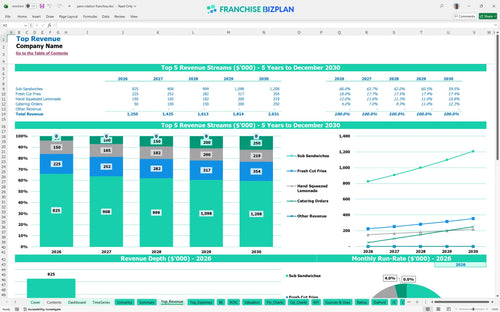
Revenue stream detailed view
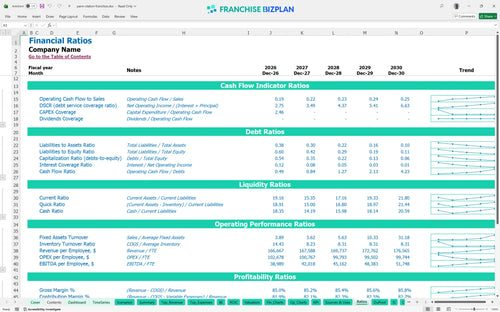
Performance metrics benchmark
We built this franchise unit financial model using extensive research on the sandwich industry to provide a realistic starting point for your planning. Key assumptions like the $14,000 monthly rent and tiered staffing costs are pre-populated with researched data and are fully editable. You can learn how to forecast catering revenue for a restaurant by adjusting the dedicated catering module, which scales from $50,000 to $250,000 in this model.
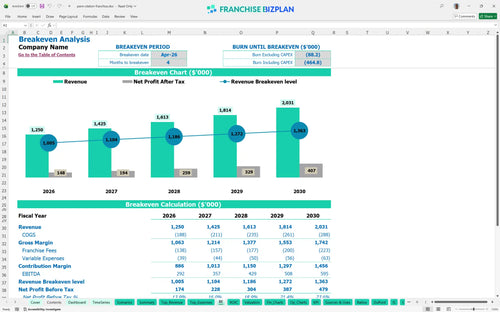
The franchise unit is projected to reach monthly profitability by April 2026, just four months after opening. This assumes you hit the $1.25 million year-one revenue target while maintaining a disciplined store-level EBITDA of $292,000.
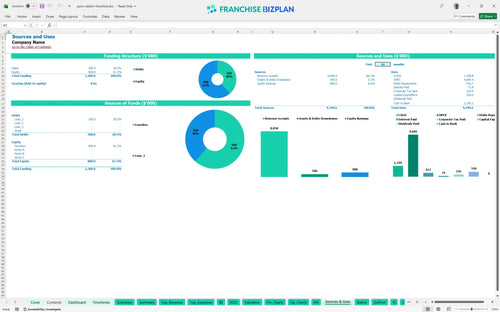
You need a total of $550,000 in capital expenditure forecasting to launch this unit, which includes the $25,000 initial fee and $220,000 for leasehold improvements. The model suggests a minimum cash buffer of $690,000 to navigate the ramp-up phase through May 2026.
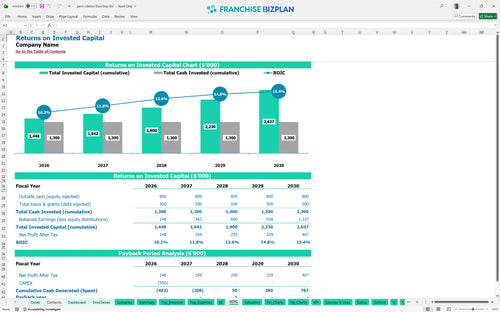
Your ROI analysis shows a 3-year payback period and an Internal Rate of Return (IRR) of 4.49%. The Return on Equity (ROE) is 1.67, with EBITDA climbing to $595,000 by the fifth year of operation.
The monthly break-even point is reached in April 2026, driven primarily by the high-volume lunch traffic required to cover the $14,000 prime location rent. Labor costs for the 4.5 year-one crew members represent the most significant variable lever for reaching this point faster.
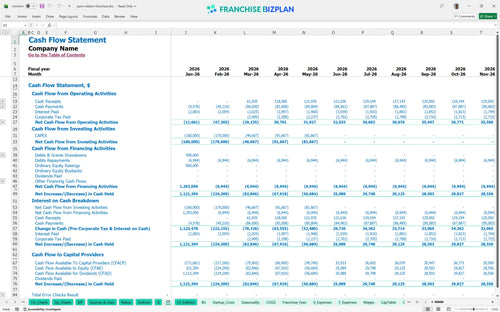
The lowest cash point occurs in May 2026, meaning you need at least five months of operating runway to handle the initial ramp-up. Evaluating profitability of a retail food franchise requires a defintely cautious approach to cash reserves during the first 120 days.
A franchise unit financial feasibility study shows that the High scenario, driven by $250,000 in annual catering, significantly accelerates your payback. Conversely, a 10% drop in sub sales in the Low scenario could push your peak cash need higher during the 2026 ramp-up.
This financial model template for fast casual restaurant operations is fully customizable in Excel, allowing you to adjust everything from sandwich prices to local labor rates. It features pre-filled formulas and editable assumptions that make it easy to adapt this franchise financial model template to your specific territory and real estate costs.

Plan your long-term growth with detailed 5-year revenue, cost, and cash flow projections designed for financial planning for multi-unit restaurant owners. The model tracks your progress as revenue grows from $1.25 million in the first year to over $2.03 million by year five, providing a clear view of your future franchise unit financial projections.

This tool helps you master franchise unit economics by automating the calculation of the 8% royalty and 3% marketing fund contributions. By capturing these specific financial obligations upfront, you can understand the real impact of brand fees on your store-level margin before you even sign a lease.

Knowing how to calculate startup costs for a sub shop franchise is the first step to securing funding, and this model maps out the entire $550,000 capital requirement. Use the franchise business plan template to identify your monthly fixed costs and determine the exact sales volume needed to reach your break-even point calculation.

The model includes built-in benchmarks for fast casual franchise profitability, helping you sanity-check your food costs which start at 13.2% of sales. Estimating labor and food costs for sandwich franchises becomes simpler when you can compare your operating expense ratio against established industry standards.


Simply purchase and download the financial model template, then access it instantly using Microsoft Excel or Google Sheets. No installation or technical expertise required-just open and start working.

Enter your business-specific numbers, including revenue projections, costs, and investment details. The pre-built formulas will automatically calculate financial insights, saving you time and effort.

Leverage the investor-ready format to confidently showcase your financial projections to banks, franchise representatives, or investors. Impress stakeholders with clear, data-driven insights and professional reports.

Leverage the investor-ready format to confidently present your projections to banks, franchise representatives, or investors.