


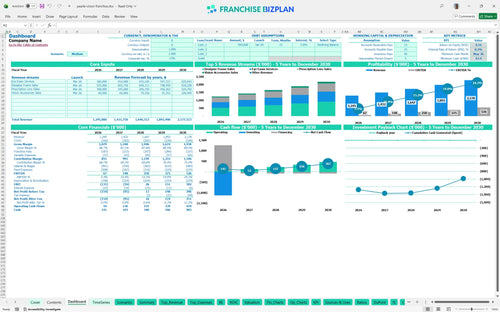
All-in-one Dashboard
Core inputs and core outputs



The franchise unit financial model includes dynamic dashboards, 5-year pro forma statements, and detailed CAPEX tracking to manage your entire investment lifecycle.
Core inputs and core outputs
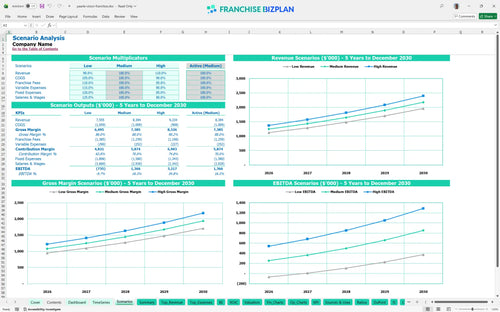
Three scenario analysis
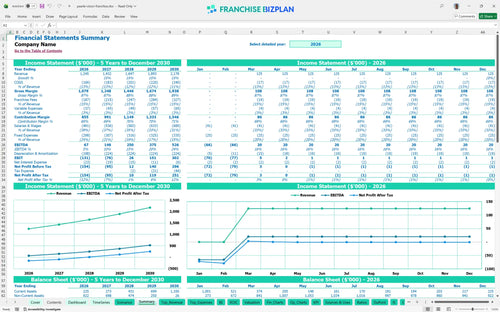
Presentation ready
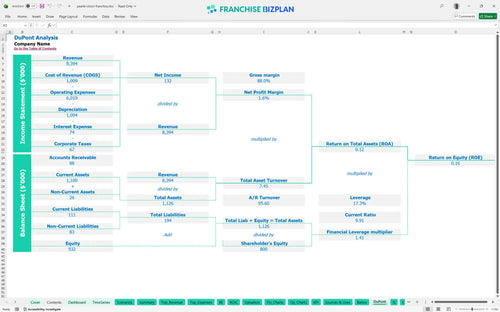
DuPont analysis
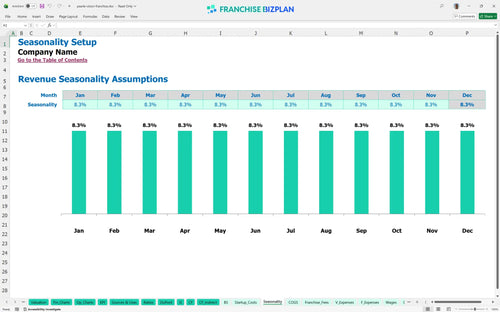
Researched revenue assumptions
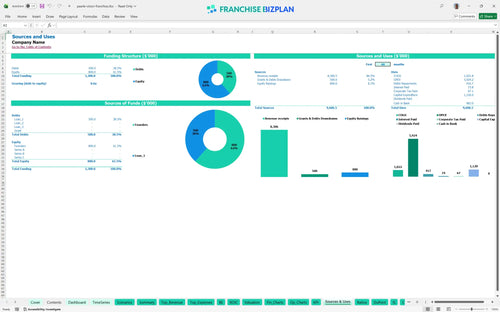
Lender-friendly financial outputs
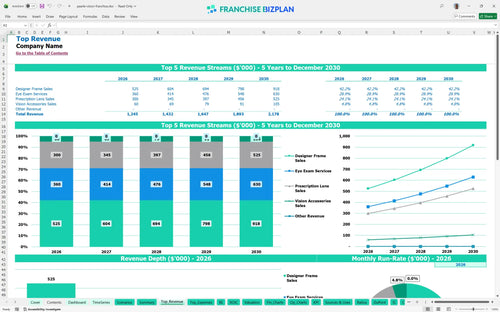
Revenue stream detailed view
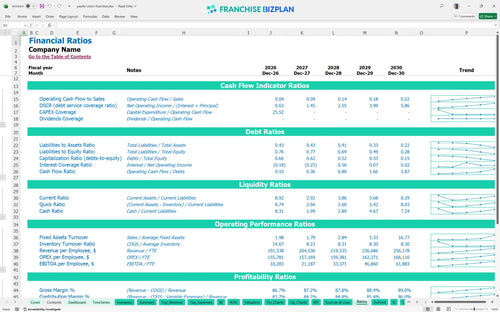
Performance metrics benchmark
We built this optical franchise business plan model using extensive research into the vision care sector. Key assumptions, including the $1.24M Year 1 revenue target and the 15% total brand fees, are pre-populated and fully editable to match your specific Austin or US-based territory. This data-driven approach ensures you are planning with realistic figures for diagnostic equipment, licensed staffing, and retail throughput.
Your unit is projected to generate a positive EBITDA of $67,000 in its first year, scaling significantly to $526,000 by Year 5 as you build patient loyalty. By estimating profitability for optical franchise locations through this lens, we see that while Year 1 margins are thin at 5.3%, the model shows strong operating leverage as revenue grows toward $2.1 million.
You will need approximately $1,120,000 to launch this unit, with the largest allocation going toward leasehold improvements and high-end diagnostic equipment. This capital expenditure planning covers everything from the $30,000 initial fee to the $70,000 required for opening inventory. Knowing how to calculate startup costs for a retail franchise properly prevents mid-construction cash crunches.
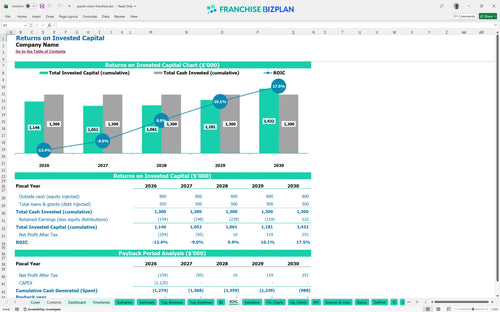
The model projects an Internal Rate of Return (IRR) of 22% and a Return on Equity (ROE) of 16%, which are defintely solid figures for a medical-retail hybrid. While the cash payback period extends after Year 5 due to the high initial CAPEX, the long-term asset value and growing EBITDA make evaluating franchise investment return with financial models a clear 'yes' for multi-unit operators. This return on investment calculation assumes you hit your Year 3 revenue target of $1.64 million.
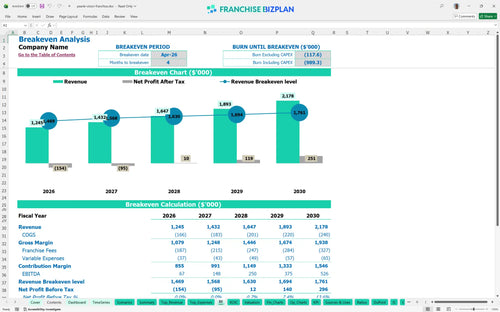
The unit reaches its monthly break-even point in April 2026, just 4 months after opening for service. This quick turn is driven by the high average ticket of designer frames and prescription lenses, which are key performance indicators for optical retail franchises. Using this spreadsheet for tracking franchise unit revenue streams, you can see that hitting $100,000 in monthly sales is the critical threshold to cover your $18,000 rent and specialized payroll.
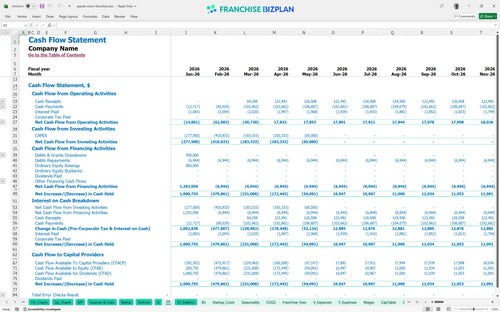
The lowest cash point occurs in May 2026, with a minimum cash balance of $63,000 remaining in the business. This highlights the importance of maintaining a franchise unit budget and cash flow projections that include a sufficient working capital buffer. Managing operating costs for a medical vision center during the first six months is vital to surviving the gap between paying staff and receiving insurance reimbursements.
Using an Excel template for franchise financial forecasting allows you to see that a 10% drop in revenue in Year 1 could push your break-even back by several months and significantly lower your IRR. Conversely, the high-growth scenario shows Year 5 EBITDA exceeding $600,000 if you capture more tech professional corporate accounts. The model demonstrates that profitability timing is most sensitive to your capture rate of high-margin designer frame sales.
Finance: update unit break-even and payback model by Friday
This franchise financial model template is built in Excel to give you total control over your assumptions. You can adjust every driver from exam volume to frame margins, making it a versatile financial model for medical retail business unit planning across different territories. The pre-filled formulas handle the heavy lifting, so you can focus on testing how different staffing levels or local rent prices impact your bottom line.

Success in the optical industry requires long-term revenue stream forecasting to account for patient retention and frame replacement cycles. This tool provides detailed franchise unit financial projections over a 60-month period, helping you visualize the path from a $1.24 million Year 1 to over $2.17 million by Year 5. It is an essential tool for preparing financial projections for franchise loan applications where lenders demand a clear view of future cash flows.

Operating under a major brand means managing significant franchise operating expenses that sit right at the top of your P&L. This model specifically tracks the 7% royalty and 8% marketing fund contribution, which total 15% of your gross sales before you even pay for rent or lab supplies. By automating these calculations, you can see exactly how much cash stays in the unit to cover your local overhead and debt service.

The initial build-out for a medical vision center is capital intensive, often requiring over $1.1 million in retail franchise startup costs. This model includes a detailed break-even analysis to show you the exact month your revenue covers both fixed and variable costs. Understanding your margin contribution is vital when you are balancing high-end designer frame sales against the fixed costs of a prime corner-cap retail location.

We have integrated real-world data into this franchise profitability analysis to help you sanity-check your numbers against industry norms. From the $140,000 lead optometrist salary to the 11.5% cost of goods for frames and lenses, these benchmarks ensure your model reflects the actual costs of running a premium optical unit. Comparing your projected performance against these standards helps identify potential margin leaks before you sign a lease.


Simply purchase and download the financial model template, then access it instantly using Microsoft Excel or Google Sheets. No installation or technical expertise required-just open and start working.

Enter your business-specific numbers, including revenue projections, costs, and investment details. The pre-built formulas will automatically calculate financial insights, saving you time and effort.

Leverage the investor-ready format to confidently showcase your financial projections to banks, franchise representatives, or investors. Impress stakeholders with clear, data-driven insights and professional reports.

Leverage the investor-ready format to confidently present your projections to banks, franchise representatives, or investors.