
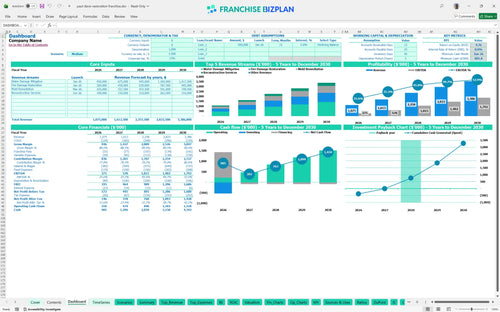
All-in-one Dashboard
Core inputs and core outputs


This comprehensive Excel tool provides a pre-populated, data-driven framework for analyzing the unit economics of a leading restoration franchise from startup through five years of operations.
Core inputs and core outputs
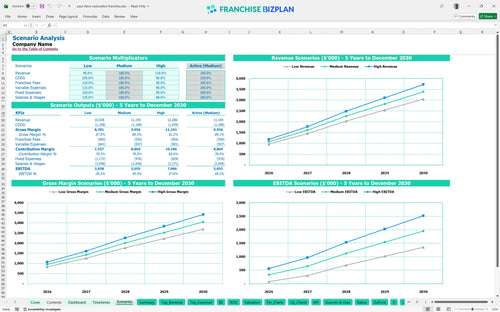
Three scenario analysis
Presentation ready
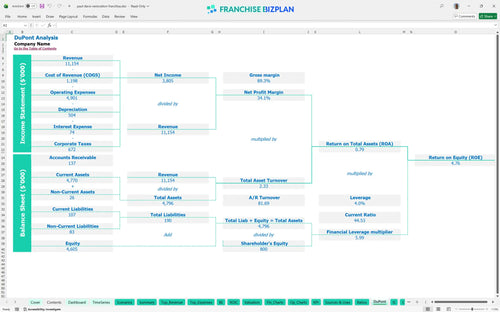
DuPont analysis
Researched revenue assumptions
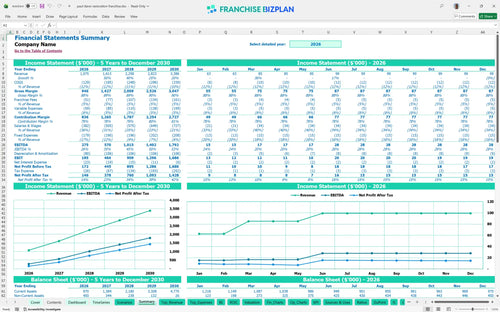
Lender-friendly financial outputs
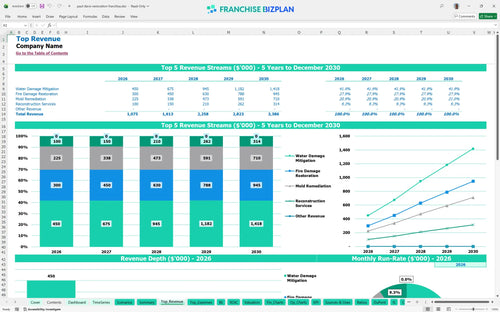
Revenue stream detailed view
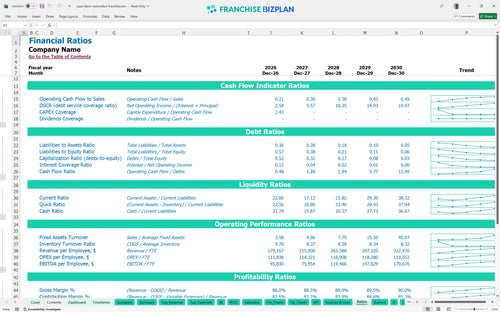
Performance metrics benchmark
We built this restoration business plan template using deep-dive research into the property recovery sector. The model comes pre-loaded with realistic assumptions like a $1,075,000 year-one revenue target and a 4% royalty structure, but you can defintely edit everything to match your specific market conditions. This financial model template for disaster restoration startup is designed to show you exactly how EBITDA can scale from $275,000 to $1,792,000 as your crew count grows.
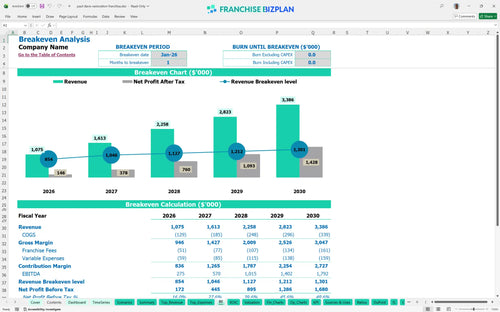
The restoration franchise profitability analysis shows this unit hitting its break-even point almost immediately in January 2026, thanks to the high-margin nature of mitigation services. While year one is about stabilizing, you see a massive jump in EBITDA by year three as reconstruction services and mold remediation reach full scale.
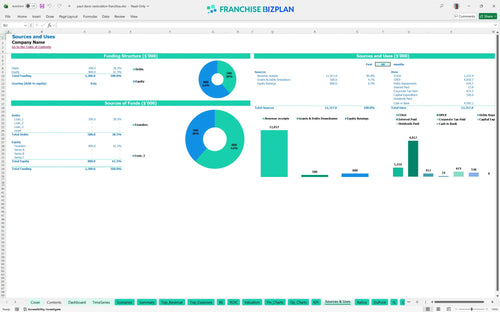
You will need to know how to estimate startup costs for a restoration franchise, which total roughly $530,000 to get the doors open. This covers the $65,000 franchise fee, $150,000 in leasehold improvements, and over $150,000 in specialized drying and extraction equipment, forming the core startup capital requirements for restoration franchise success.
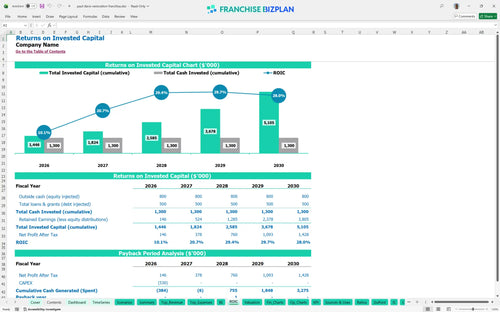
The model projects a 3-year payback period on your initial capital, which is solid for a disaster mitigation business. With an IRR of 7.95% and a year-five EBITDA margin north of 50%, the business valuation for franchises in this sector looks strong for multi-unit operators based on our franchise ROI calculation.
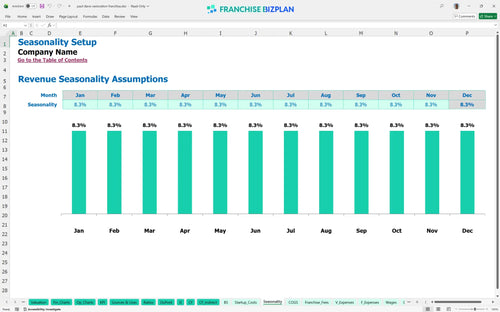
Calculating break-even point for restoration business units shows monthly break-even is achieved in the very first month of operation. The biggest lever here is your revenue forecasting model for restoration services, specifically water damage mitigation, which represents nearly 30% of your initial revenue mix and carries the best margins.
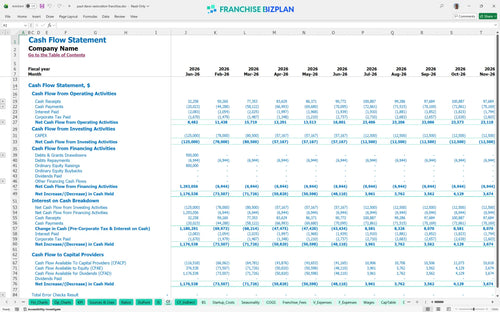
Your lowest cash point hits in June 2026 at $882,000, including your initial capital buffer. You need to watch the gap between finishing a job and receiving insurance payouts, as working capital can get trapped in accounts receivable, making a financial due diligence checklist for prospective franchisees essential during the ramp-up.
In a high-growth scenario where revenue hits the $3,386,000 mark by year five, your fixed costs like the $8,500 rent become negligible. However, if labor costs spike or technician productivity drops, your year-1 margin of 25% could easily compress, which is why a detailed financial forecast for new franchise units and profit margin analysis for property restoration companies is critical.
Finance: update unit break-even and payback model by Friday.
This restoration franchise financial model is built in Excel to be fully flexible for your specific territory. You can tweak every assumption, from local labor rates to specific equipment costs, ensuring the numbers reflect your actual market reality rather than just a generic estimate. It is the ultimate Excel template for restoration franchise business planning.

We mapped out a 5-year path where revenue scales from $1,075,000 in year one to over $3,386,000 by year five. These detailed franchise unit financial projections help you plan for the transition from a hands-on owner-operator to a multi-crew enterprise, tracking how margins shift as you add more restoration technicians and vehicles.

Managing the 4% royalty and 0.75% marketing fund is baked directly into the cash flow. By automating these calculations within the franchise royalty fee structure, you can see exactly how much goes to corporate before you pay your rent or technicians, which is vital for maintaining your store-level margin.

Starting a restoration business requires significant upfront capital for specialized drying and mitigation equipment. This franchise startup cost calculator helps you visualize the $530,000+ initial investment and identifies the exact volume of water or fire jobs needed each month to cover your $8,500 facility lease and other fixed overhead.

Don't fly blind; use the built-in benchmarks to see if your 10.5% material cost or 3% fuel expense is in line with property restoration industry trends. This restoration franchise operating expense spreadsheet provides guardrails to help you spot margin leaks early, especially when managing 24/7 emergency response logistics.


Simply purchase and download the financial model template, then access it instantly using Microsoft Excel or Google Sheets. No installation or technical expertise required-just open and start working.

Enter your business-specific numbers, including revenue projections, costs, and investment details. The pre-built formulas will automatically calculate financial insights, saving you time and effort.

Leverage the investor-ready format to confidently showcase your financial projections to banks, franchise representatives, or investors. Impress stakeholders with clear, data-driven insights and professional reports.

Leverage the investor-ready format to confidently present your projections to banks, franchise representatives, or investors.