
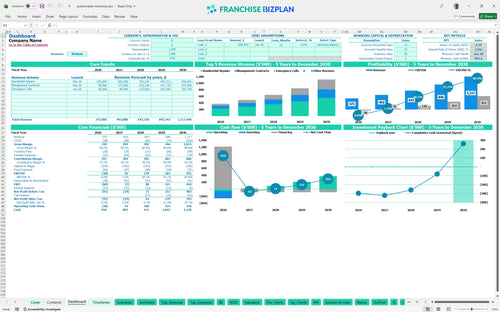
All-in-one Dashboard
Core inputs and core outputs


This model provides a detailed, five-year financial roadmap for a mobile repair franchise, covering everything from initial van purchases to long-term exit value.
Core inputs and core outputs
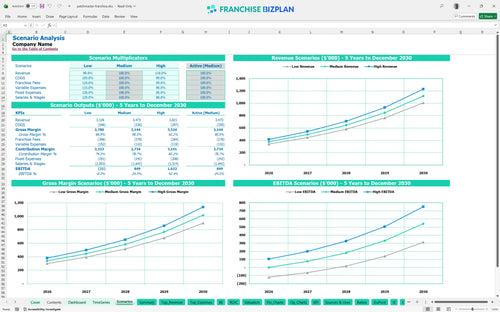
Three scenario analysis
Presentation ready
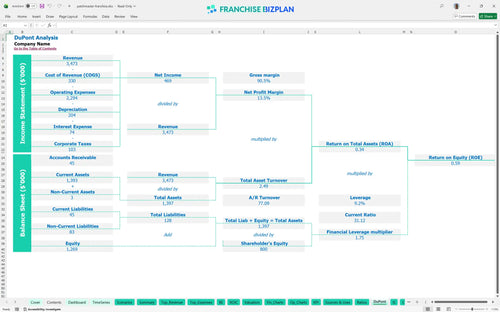
DuPont analysis
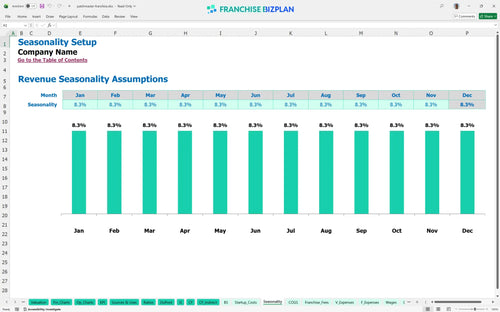
Researched revenue assumptions
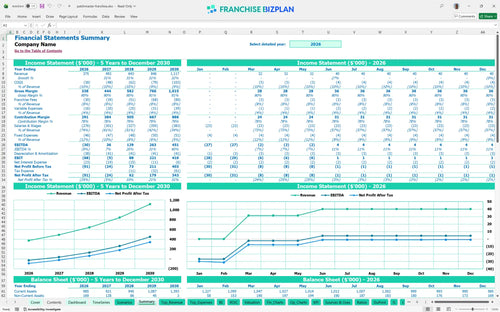
Lender-friendly financial outputs
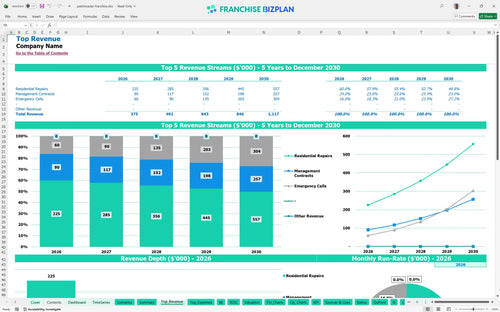
Revenue stream detailed view
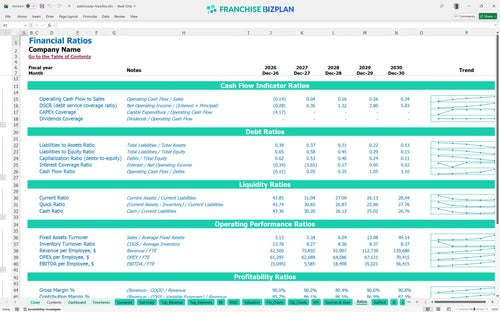
Performance metrics benchmark
We built this Excel template for home service franchise financial planning using deep research into the unit economics of mobile repair and drywall services. Key assumptions like the $49,500 franchise fee, technician wages, and van expenses are pre-loaded but fully editable to fit your specific market. With a projected Year 5 EBITDA of $451,000 and revenue scaling to $1,117,000, this tool helps you map out the path to those numbers. It is a practical guide for any owner looking to scale from one van to a full fleet.
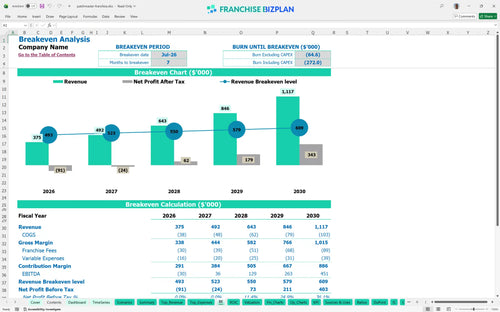
Year one shows an EBITDA loss of $30,000 as you ramp up, but the unit hits its stride quickly after that. By year two, you are looking at $36,000 in EBITDA, which scales significantly as you add more technicians. This profitability analysis for drywall and paint franchise accounts for the 7% royalty and 1% marketing fee while tracking the 10% combined material cost for drywall and paint. Profitability depends on keeping your technicians billable and your vans moving.
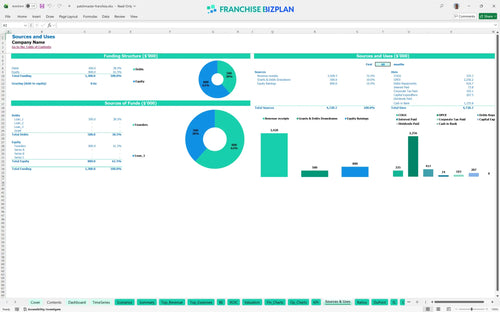
Launching this unit requires a significant upfront commitment, mainly driven by capital expenditure planning for franchises. The total cash needed to reach the lowest point is roughly $893,000, which includes the $49,500 franchise fee and $84,000 for two fully equipped service vans. This financial spreadsheet for mobile repair service business startup ensures you have enough buffer to cover the early months of operation. Honestly, undercapitalization is the number one reason new units fail.
The model shows a 5-year payback period, which is standard for a service-based business with high equipment costs. The Internal Rate of Return (IRR) sits at 2.36% over the initial five-year window, reflecting the heavy early investment in the fleet. When evaluating franchise investment opportunities in home services, look at the long-term equity growth. As the revenue scales to $1.1M in year five, the return on equity reaches 0.59. Franchise investment ROI is a marathon, not a sprint.

You hit the break-even date in July 2026, just seven months after starting operations. The primary driver for hitting this goal is projecting revenue for local home repair franchise units and managing the fixed $1,800 monthly storage rent. Since labor is your biggest variable cost, keeping your five technicians busy with residential repairs and management contracts is critical. Break-even is less about the big jobs and more about the daily volume.
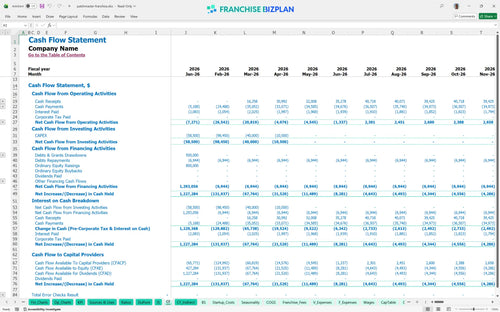
The lowest cash point occurs in January 2028, showing that you need to maintain a strong liquidity position even after the first year. This is due to the timing of adding more staff and equipment as revenue grows from $375k to $643k. Estimating labor and overhead for mobile service franchises is tricky because you have to hire ahead of the revenue curve. We recommend a solid buffer to handle the lag between service delivery and payment. Cash is king, especially during a fast ramp-up.
Moving from a medium to a high-growth scenario can drastically change your year-one margin and peak cash needs. In a high-revenue case, your $375,000 year-one sales might jump 20%, allowing you to cover the $65,000 service manager salary much sooner. Building a business case for a niche home repair franchise requires looking at the downside too. A low-growth scenario might push your break-even date past the seven-month mark, requiring more working capital to survive.
Finance: update unit break-even and payback model by Friday
This franchise financial model template lives in Excel, so you can tweak every variable to match your specific territory. Whether you are adjusting for local labor rates or specific rent costs, the pre-filled formulas handle the heavy lifting. It is basically a plug-and-play franchise business plan Excel that lets you swap assumptions in seconds. Honestly, being able to change your mind without breaking the math is a lifesaver.

Planning for next month is fine, but you need to see the five-year horizon to understand the true value of the business. This franchise financial projection spreadsheet maps out revenue from $375,000 in year one to over $1.1 million by year five. It tracks how your margins shift as you add more technicians and vans to the fleet. Still, long-term planning is the only way to spot a cash crunch before it hits your bank account.

Royalties and brand fees are non-negotiable, so we built them directly into the logic of the tool. With a 7% royalty and 1% marketing fee, you need to know exactly how much gross profit stays in your pocket after the franchisor takes their cut. This tool handles the franchise royalty fee calculation automatically based on your monthly sales volume. It defintely helps you see the net impact of brand costs on your bottom line. Plus, you can easily learn how to forecast franchise royalty and advertising fees as your volume grows.

You cannot start a business without knowing the total nut you have to crack before you see a profit. This franchise startup cost calculator totals up everything from the $49,500 franchise fee to the $84,000 needed for the first two service vans. It shows you the exact sales volume needed to cover your storage rent and payroll. Knowing how to calculate startup costs for a service franchise is the difference between sleeping well and staring at the ceiling. One-point margin leaks can sink a new unit fast.

We did not just guess these numbers; we used real-world data to provide a realistic franchise unit profitability analysis. The model includes small business franchise metrics for typical labor and material costs in the repair space. If your drywall compound costs are way higher than the 7.5% benchmark, you know exactly where to look for waste. Use these targets to keep your manager accountable and your margins healthy. To be fair, benchmarks are just a guide, but they keep you from flying blind.


Simply purchase and download the financial model template, then access it instantly using Microsoft Excel or Google Sheets. No installation or technical expertise required-just open and start working.

Enter your business-specific numbers, including revenue projections, costs, and investment details. The pre-built formulas will automatically calculate financial insights, saving you time and effort.

Leverage the investor-ready format to confidently showcase your financial projections to banks, franchise representatives, or investors. Impress stakeholders with clear, data-driven insights and professional reports.

Leverage the investor-ready format to confidently present your projections to banks, franchise representatives, or investors.