
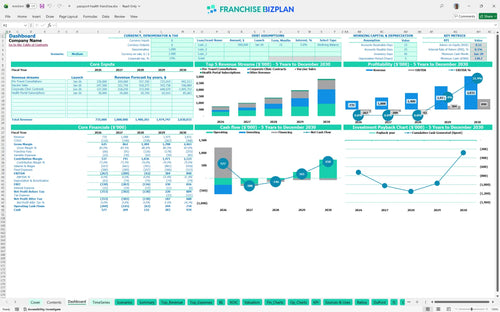
All-in-one Dashboard
Core inputs and core outputs


This financial model template for healthcare service franchise units provides a complete Excel-based toolkit for forecasting revenue, expenses, and investment returns.
Core inputs and core outputs
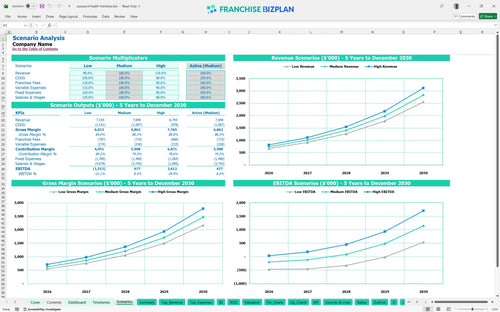
Three scenario analysis
Presentation ready
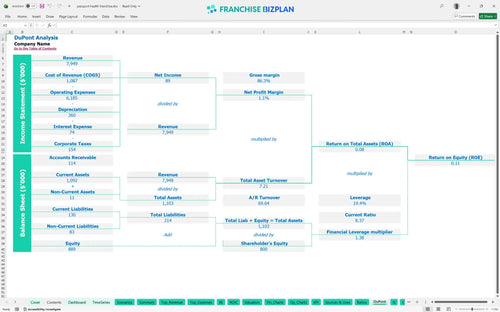
DuPont analysis
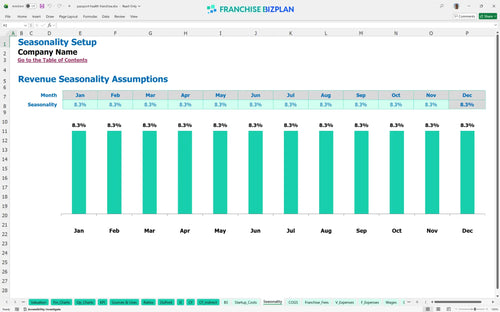
Researched revenue assumptions
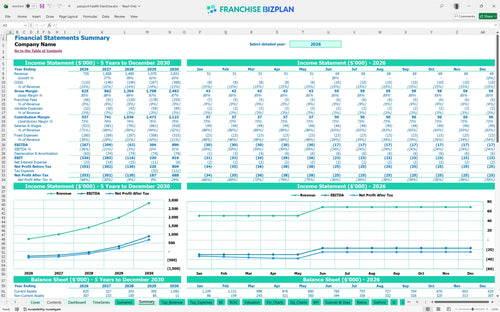
Lender-friendly financial outputs
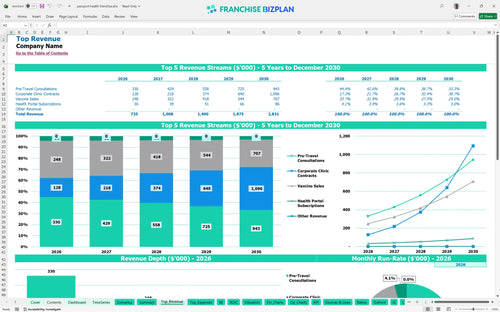
Revenue stream detailed view
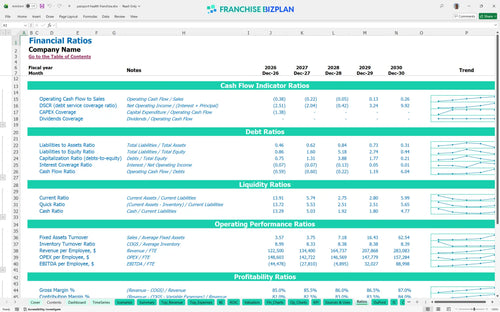
Performance metrics benchmark
We built this franchise unit financial model using our own research to ensure it reflects the realities of the travel health sector. Key assumptions, such as the $735,000 year-one revenue and specific clinical revenue forecasting for B2B contracts, are pre-populated and fully editable. This data-driven approach helps you evaluate the feasibility of a clinic in a high-traffic district like Domain Northside.
The clinic is projected to reach positive EBITDA in Year 4, with a significant jump to $890,000 in Year 5. While the first three years show negative EBITDA due to high fixed costs and staffing, the model demonstrates how scaling B2B corporate health contract revenue model services drives the eventual pivot to profit.
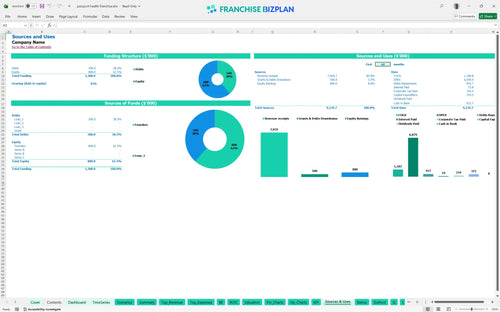
You will need approximately $370,500 in upfront capital for fixed assets and fees, plus a significant working capital buffer to cover early-stage losses. This includes $140,000 for build-out and $65,000 for medical exam equipment to ensure a premium patient experience from day one.
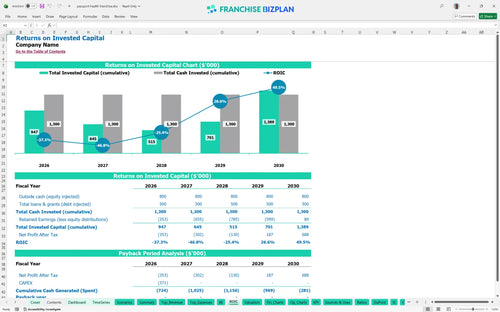
The franchise investment return analysis spreadsheet shows an Internal Rate of Return (IRR) of 12% and a Return on Equity (ROE) of 11%. Because of the heavy initial investment and the 37-month ramp-up, full payback of the original capital occurs after the fifth year of operations.
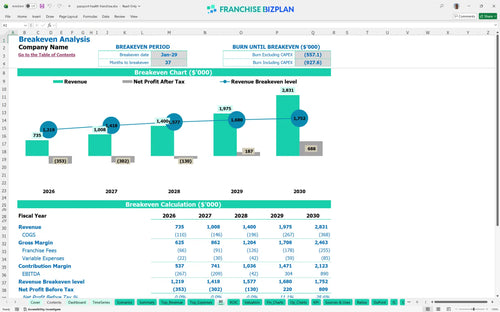
The unit reaches its break-even date in January 2029, exactly 37 months after launch. The primary driver for this timeline is the high fixed overhead, specifically the $16,500 monthly rent and the $125,000 Clinic Director salary, which require significant volume to offset.
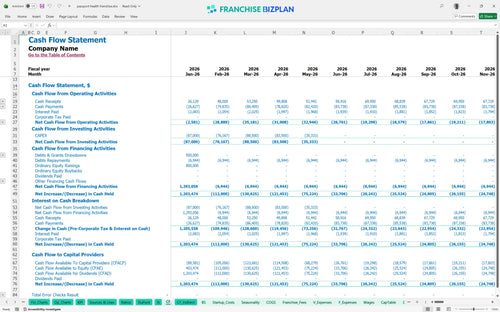
Your lowest cash point occurs in January 2029, where the minimum cash balance is projected at $121,000. You defintely need to ensure your initial funding covers the cumulative losses of the first three years, as Year 1 alone sees an EBITDA loss of $267,000 during the initial ramp.
A financial feasibility study for travel health franchise units shows that a 10% drop in revenue can push the break-even point into Year 5. Conversely, hitting the High case through aggressive B2B sales execution significantly improves the Year 1 margin and reduces the peak cash need during the startup phase.
This franchise unit economics spreadsheet provides a flexible framework for modeling a specialized medical clinic. It features pre-filled formulas and editable assumptions in Excel, allowing you to adjust local market data, pricing, and volume to fit your specific territory. Whether you are a first-time owner or a multi-unit CFO, you can use this tool to stress-test your assumptions before signing a lease.

Long-term planning is critical in healthcare where ramp-up periods can be extended. This model delivers detailed healthcare franchise financial projections over a 60-month horizon, tracking the transition from initial losses to mature-unit profitability. You get a clear view of how B2B contracts and vaccine sales scale over time to drive the bottom line.

Operating a branded clinic involves specific financial obligations that impact your store-level margin. The model automates franchise royalty calculations at 7% and marketing fund contributions at 2% of gross sales. By factoring in these ongoing costs alongside the initial $50,000 franchise fee, you can see the true net cash flow available to the operator.

Understanding travel clinic startup costs is the first step toward a successful launch. This tool helps you map out the total healthcare business startup capital required, including $140,000 for leasehold improvements and $65,000 for medical equipment. It calculates the exact sales volume needed to cover your $16,500 monthly rent and high-caliber medical staff payroll.

We have integrated industry-specific data to help you calculate the medical clinic profit margin with confidence. The model includes benchmarks for vaccine procurement costs, which start at 11.5% of sales, and labor targets for Nurse Practitioners and Clinic Directors. Use these figures to sanity-check your operational budget template for healthcare clinics against real-world standards.


Simply purchase and download the financial model template, then access it instantly using Microsoft Excel or Google Sheets. No installation or technical expertise required-just open and start working.

Enter your business-specific numbers, including revenue projections, costs, and investment details. The pre-built formulas will automatically calculate financial insights, saving you time and effort.

Leverage the investor-ready format to confidently showcase your financial projections to banks, franchise representatives, or investors. Impress stakeholders with clear, data-driven insights and professional reports.

Leverage the investor-ready format to confidently present your projections to banks, franchise representatives, or investors.