
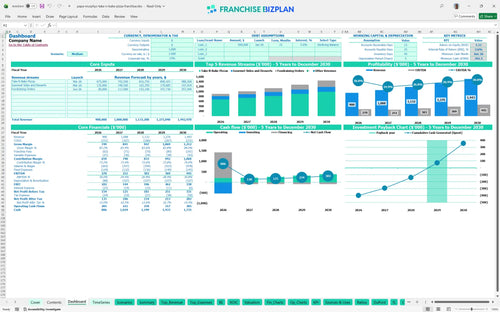
All-in-one Dashboard
Core inputs and core outputs


This template provides a complete financial planning for food service franchise unit toolkit, including P&L (profit and loss) statements, cash flow trackers, and automated break-even calculators. This is your complete financial roadmap.
Core inputs and core outputs
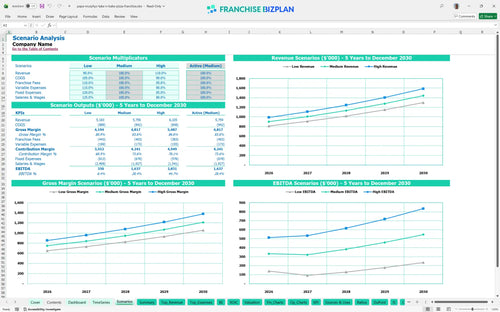
Three scenario analysis
Presentation ready
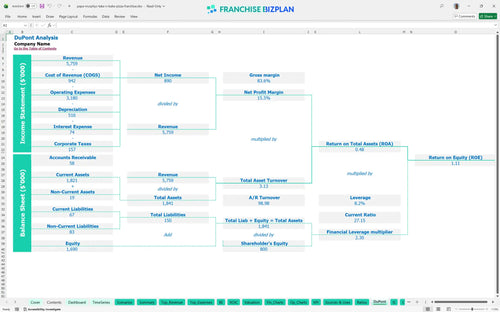
DuPont analysis
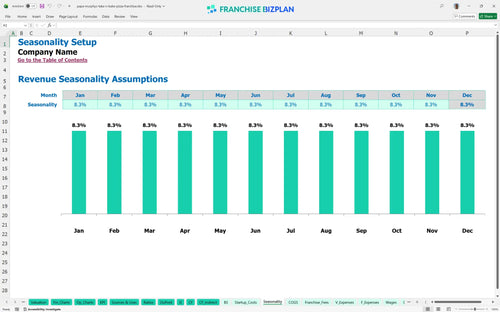
Researched revenue assumptions
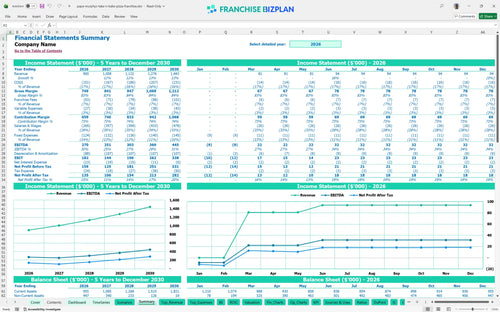
Lender-friendly financial outputs
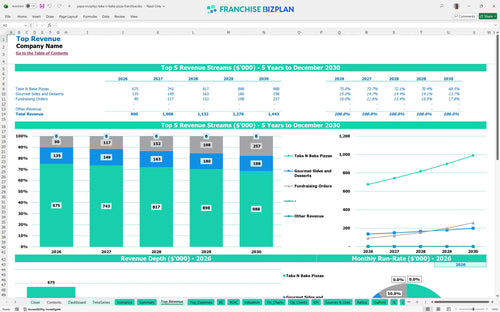
Revenue stream detailed view
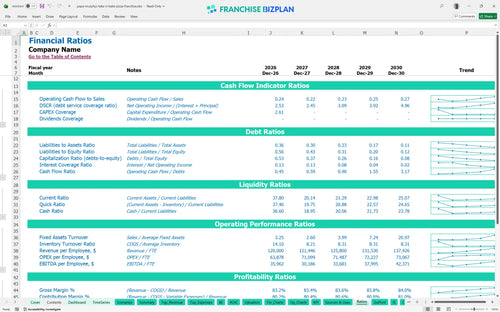
Performance metrics benchmark
We built this franchise unit financial model using our own research. Key assumptions like the $900,000 Year 1 revenue and 5% royalty fees are pre-populated with researched data specific to Papa Murphy's Take 'N' Bake Pizza Franchise franchise unit and are fully editable. Research meets reality in this template.
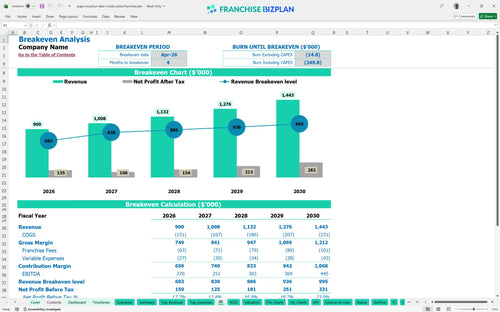
You can expect to hit the break-even point by April 2026, just four months after the initial investment begins. The model shows Year 1 EBITDA at $270,000, which accounts for your 14% food costs and 5% royalty burden. Speed to profit is the name of the game.
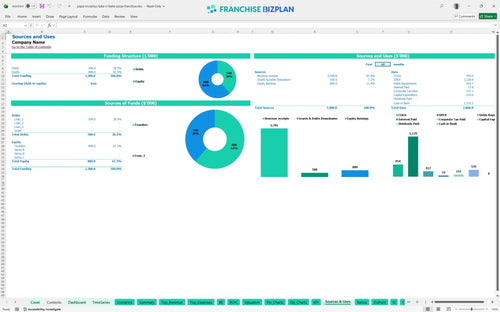
Launching this unit requires $535,000 in upfront CAPEX, with your lowest cash point hitting $765,000 in June 2026. This startup budget template for retail food business covers the $25,000 franchise fee and $280,000 in leasehold improvements. Your biggest check goes to the build-out.
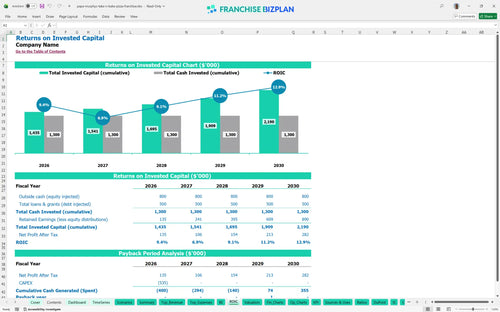
Investors can expect an Internal Rate of Return (IRR) of 3.63% and a Return on Equity (ROE) of 1.11 over the five-year hold. This take and bake pizza store profitability analysis projects a 4-year payback period, meaning you recover your initial capital by the end of 2029. Patience is required for this four-year climb.
The monthly break-even point occurs in April 2026, driven by your $7,500 monthly rent and the unit economics model. To stay in the black, you must manage the 14% food cost and 2.8% packaging expense carefully while driving volume. Rent is your biggest fixed hurdle.
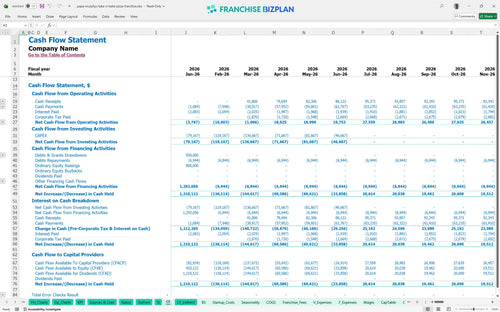
Your lowest cash point of $765,000 occurs in June 2026, roughly three months after the store opens for customers. We defintely recommend a healthy restaurant operational budget buffer to cover the $173,500 annual crew member payroll during the early ramp-up months. Cash is king during the first six months.
The high scenario projects Year 5 revenue reaching $1,443,000, significantly boosting your store-level EBITDA. This financial model for new franchise location shows that even small improvements in crew productivity or a 1% drop in food costs significantly change your year-1 margin. Small wins in labor create big wins in profit.
This Excel-based pizza franchise financial model allows you to swap out every assumption to fit your specific territory. You can adjust the pre-filled formulas to reflect local rent hikes or different labor laws without breaking the math. Every cell is open for your local data.

Map out your growth from a $900,000 Year 1 revenue to over $1.4 million by Year 5 with this restaurant business financial projection. It tracks how EBITDA (earnings before interest, taxes, depreciation, and amortization) evolves as your unit scales and matures. Watch your margin grow over sixty months.

Royalties and marketing funds are off the top expenses that eat into your margin before you pay a single employee. This take and bake franchise investment analysis accounts for the 5% royalty and 2% marketing fee automatically based on your sales volume. Royalties come out before you pay yourself.

Knowing when you stop losing money and start making it is vital for any new owner. This franchise unit profitability spreadsheet identifies your $535,000 total CAPEX (capital expenditure) and calculates the exact sales volume needed to cover your $7,500 monthly rent. Know your number before you sign the lease.

Don't guess if your food costs are too high; compare them against the model's pre-set 14% food ingredient benchmark. Using this pizza franchise return on investment calculator helps you see if your $27,500 crew member salaries align with typical industry standards for a retail food business. Compare your shop to the best in the business.


Simply purchase and download the financial model template, then access it instantly using Microsoft Excel or Google Sheets. No installation or technical expertise required-just open and start working.

Enter your business-specific numbers, including revenue projections, costs, and investment details. The pre-built formulas will automatically calculate financial insights, saving you time and effort.

Leverage the investor-ready format to confidently showcase your financial projections to banks, franchise representatives, or investors. Impress stakeholders with clear, data-driven insights and professional reports.

Leverage the investor-ready format to confidently present your projections to banks, franchise representatives, or investors.