
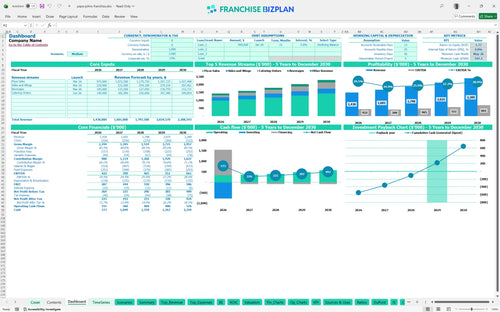
All-in-one Dashboard
Core inputs and core outputs


This comprehensive toolkit includes a dynamic Excel dashboard, pre-configured financial statements, and a detailed CapEx tracker designed specifically for high-volume pizza delivery operations.
Core inputs and core outputs
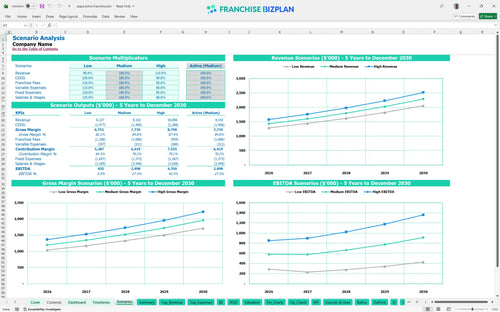
Three scenario analysis
Presentation ready
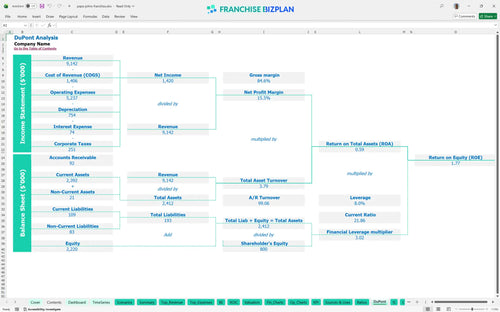
DuPont analysis
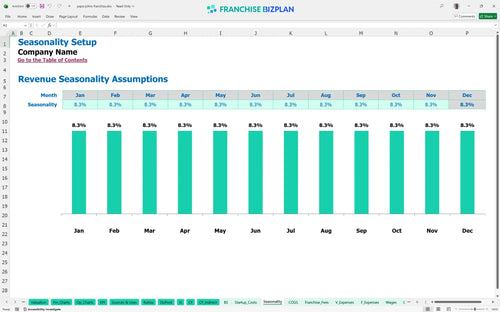
Researched revenue assumptions
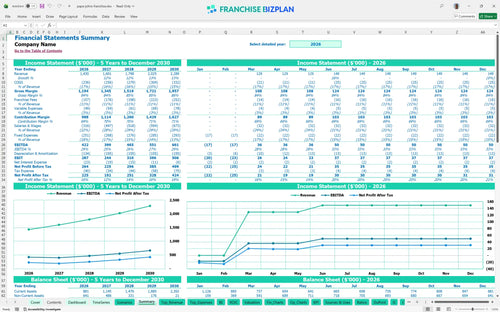
Lender-friendly financial outputs
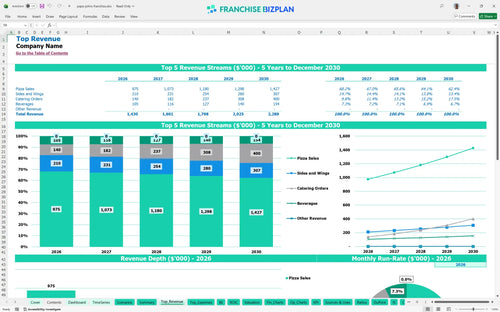
Revenue stream detailed view
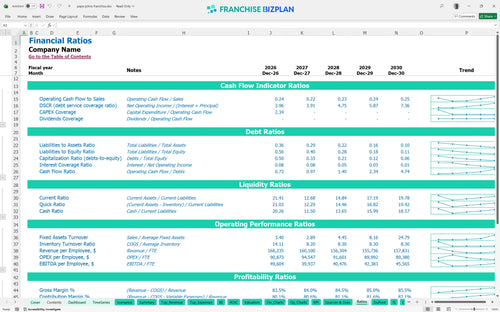
Performance metrics benchmark
We built this franchise unit financial model using deep-dive research into high-volume pizza delivery economics. Key assumptions like the $1.43M Year 1 revenue and the 11% combined royalty and marketing fee are pre-populated and fully editable to match your specific urban territory. Honestly, the model is designed to show you exactly where the cash goes, from the $350,000 leasehold improvements to the daily delivery driver wages.
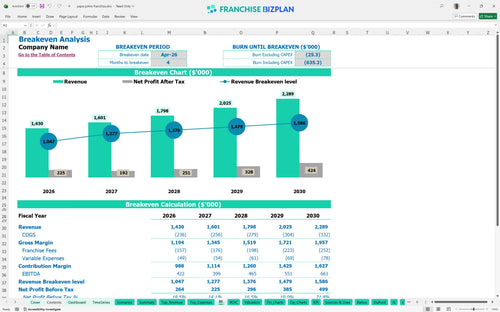
Profitability hits quickly in this model, with the unit reaching break-even by April 2026, just four months after launch. By Year 1, you are looking at an EBITDA of $422,000, though this requires keeping food costs at 14% and managing a lean staffing roster during the initial ramp-up phase.
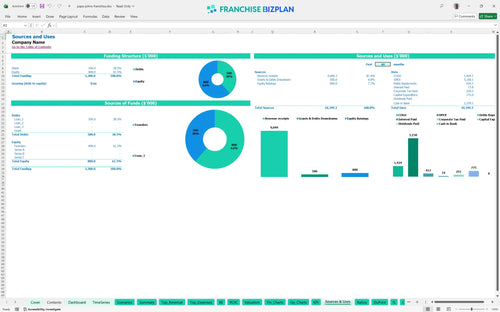
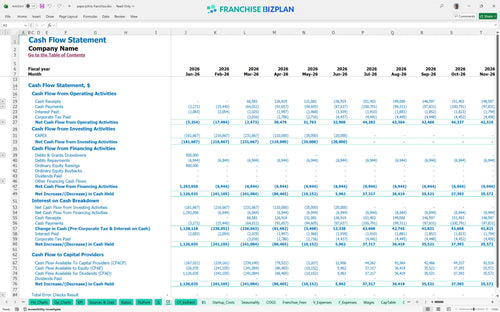
Launching this unit requires a total investment of $775,000 to cover everything from the $25,000 franchise fee to the $150,000 in kitchen equipment. You'll also need to account for a cash buffer, as the minimum cash point hits $547,000 in May 2026 during the early operational phase.
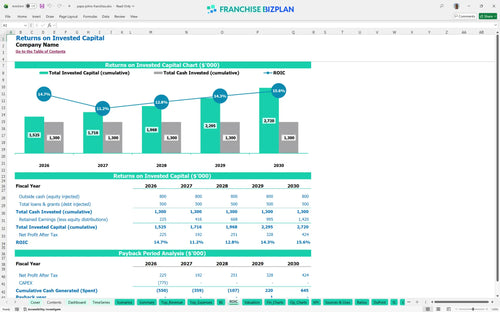
Investors can expect a 4-year payback period on their initial capital outlay. While the 3.96% IRR might look conservative, it reflects a realistic ramp-up in a competitive market, leading to a Year 5 EBITDA of $661,000 and a steady return on equity of 1.77.
The unit reaches its break-even point in April 2026, driven largely by the $1.43M first-year revenue target. The biggest factor affecting this timeline is your ability to manage the $15,000 monthly rent and the 11% total royalty burden while maintaining high order volume from day one.
Your lowest cash point occurs in May 2026, with a balance of $547,000. This means you need to have your financing defintely secured before the heavy CapEx phase in early 2026 to avoid a liquidity crunch during the signage and exterior buildout phase.
The model allows you to toggle between scenarios to see how a 10% drop in pizza sales affects your 4-year payback. A high-performance scenario, driven by strong catering and $399,854 in Year 5 catering revenue, significantly improves your IRR and shortens the time to recover your initial $775,000 investment.
Finance: update unit break-even and payback model by Friday
This Excel-based franchise financial model lets you adjust every variable to fit your specific territory and local market conditions. You can swap out rent, labor rates, and delivery fees to see how they impact your bottom line before signing a lease. The fast food franchise financial template is built for speed, allowing you to test different pricing strategies for your pizza and sides in seconds.

Map out your path from grand opening to a mature multi-unit operation with detailed annual projections. The model tracks revenue growth from $1.43 million in Year 1 to over $2.28 million by Year 5, helping you visualize long-term cash flow and scalability. This pizza franchise business plan includes a full balance sheet and cash flow view to keep your expansion on solid ground.

Managing the 5% royalty and 6% marketing fund is critical for maintaining store-level margins in the pizza space. This tool automates these calculations based on your gross sales, ensuring you always know exactly what is owed to the brand each month. Analyzing franchise royalty and marketing fund expenses helps you understand the real cost of brand support versus your local operational overhead.

Total initial investment for this concept hits roughly $775,000 when accounting for leaseholds, equipment, and the initial fee. The model identifies your break-even sales level, showing you exactly how much volume you need to toss to cover fixed costs like $15,000 monthly rent. Use the restaurant startup cost calculator to avoid surprises during the build-out and equipment procurement phase.

Don't fly blind; use built-in benchmarks to see if your 14% food ingredient cost or your staffing levels align with top-performing pizza units. These guardrails help you identify margin leaks in labor or utilities before they become systemic issues. Evaluating franchise unit economics for investors becomes much simpler when you can show your numbers are within healthy industry ranges.


Simply purchase and download the financial model template, then access it instantly using Microsoft Excel or Google Sheets. No installation or technical expertise required-just open and start working.

Enter your business-specific numbers, including revenue projections, costs, and investment details. The pre-built formulas will automatically calculate financial insights, saving you time and effort.

Leverage the investor-ready format to confidently showcase your financial projections to banks, franchise representatives, or investors. Impress stakeholders with clear, data-driven insights and professional reports.

Leverage the investor-ready format to confidently present your projections to banks, franchise representatives, or investors.