
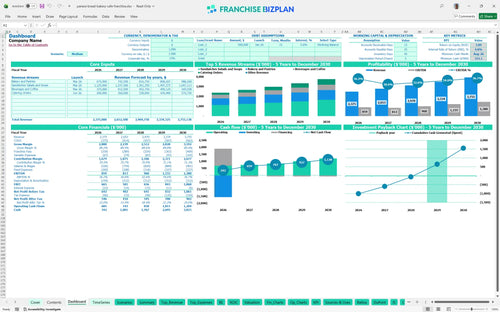
All-in-one Dashboard
Core inputs and core outputs


This Excel template for restaurant franchise financial projections provides a complete toolkit for analyzing unit economics, cash flow, and long-term investment returns.
Core inputs and core outputs
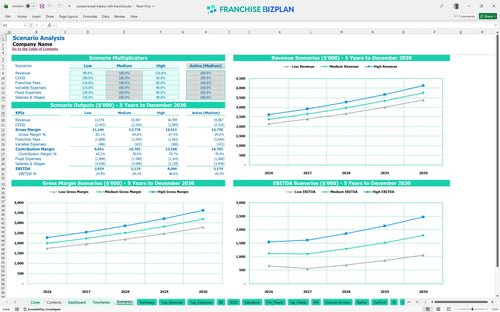
Three scenario analysis
Presentation ready
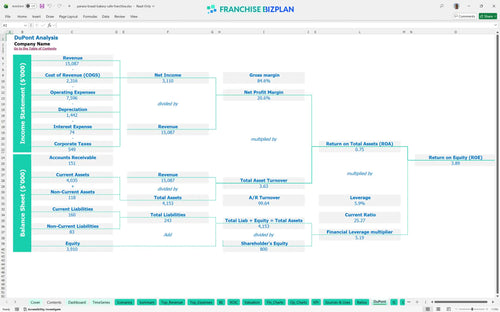
DuPont analysis
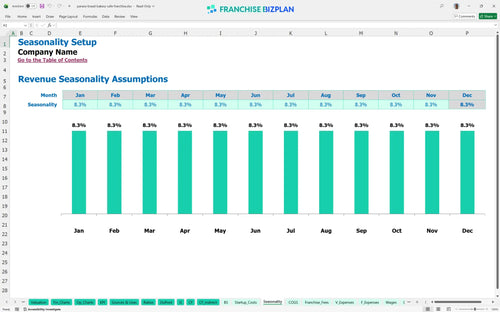
Researched revenue assumptions
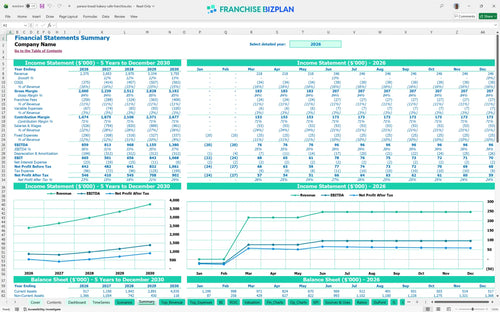
Lender-friendly financial outputs
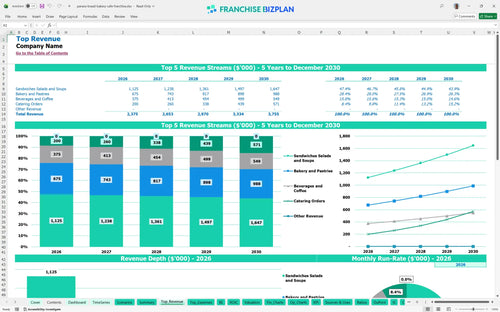
Revenue stream detailed view
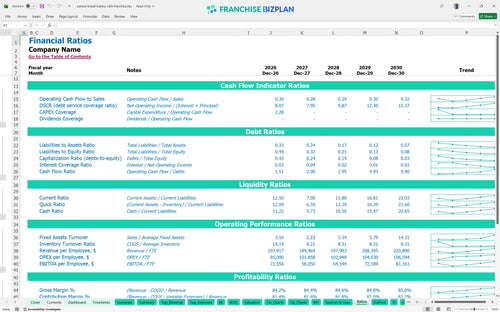
Performance metrics benchmark
We built this Panera Bread Bakery-Cafe Franchise franchise unit financial model using our own research to reflect real-world operating conditions. Key assumptions like the $2,375,000 Year 1 revenue and 10.9% total franchise fees are pre-populated and fully editable to fit your specific market. This data-driven approach helps you move from a rough estimate to a precise, bank-ready financial plan.
The unit achieves a strong $859,000 EBITDA in its first year, with margins improving as food costs drop from 14% to 13.2% by Year 5. Profitability is driven by high-volume sandwich and salad sales, which reach over $1 million annually by the end of the forecast period.
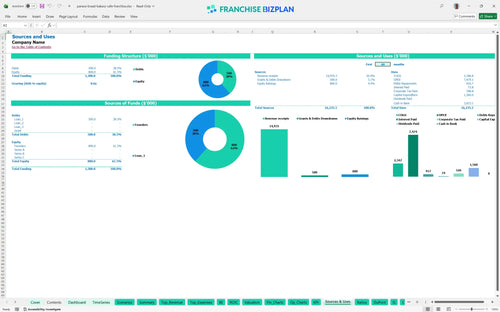
Launching this unit requires a total initial investment of approximately $1,560,000, covering everything from the $35,000 franchise fee to $850,000 in leasehold improvements. You also need to budget for $180,000 in bakery ovens and a $25,000 initial inventory load before the March 2026 opening.
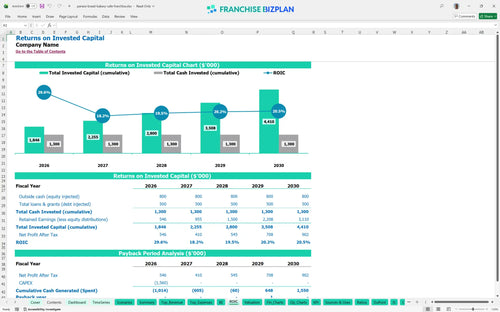
Investors can expect an Internal Rate of Return (IRR) of 4.83% and a 4-year payback period on the initial capital outlay. While the Year 1 Return on Equity (ROE) is 3.89%, the steady climb in annual revenue to $3.75M by Year 5 provides a stable long-term yield.
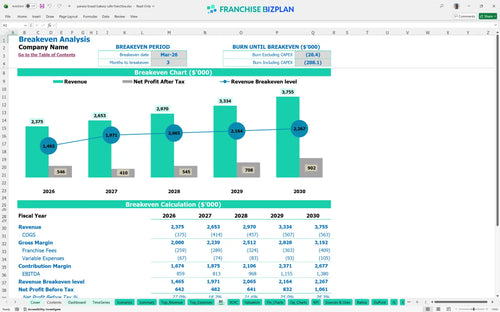
The unit reaches break-even in March 2026, just 3 months after the initial launch phase. This quick turnaround is possible if you hit the $2.37M Year 1 revenue target while managing $18,000 in monthly rent and the 5.9% marketing fee burden.
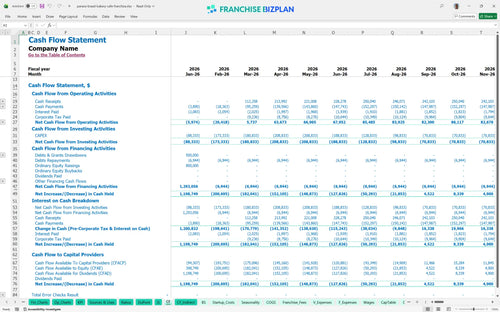
The lowest cash point occurs in August 2026 at $315,000, following the heavy CAPEX spend for furniture and signage. You need to maintain this buffer to handle the ramp-up of catering services and the 5% royalty payments that start immediately upon opening.
A High scenario driven by aggressive catering contracts could push Year 5 revenue well beyond the $3.75M base case. However, if Year 1 sales miss the $2.37M mark, the 10.9% combined royalty and marketing fees will defintely squeeze the $859,000 EBITDA target and delay the 4-year payback.
Finance: update unit break-even and payback model by Friday
This franchise financial model template is built in Excel with fully editable assumptions and pre-filled formulas to match your specific territory. You can adjust everything from local rent to hourly wages, making it easy to simulate different buisness scenarios before you sign a lease. It is a flexible tool designed to handle the moving parts of a high-volume bakery operation.

Plan your long-term growth with a detailed 5-year outlook that tracks revenue, expenses, and cash flow. The model scales from a single unit to a multi-unit view, helping you see how Year 1 startup phases transition into mature-unit profitability. It provides a clear map of your financial future from opening day through the fifth year of operations.

This tool specifically tracks the heavy lifting of franchise-specific costs like ongoing royalties and brand marketing contributions. By automating these calculations as a percentage of gross sales, you can see exactly how much cash stays in the unit after the franchisor takes their cut. It ensures your store-level EBITDA accounts for every contractual obligation.

Estimating your total initial investment is critical for securing funding and managing your early-stage cash runway. This fast casual restaurant financial model breaks down your capital expenditure budget and calculates the exact sales volume needed to cover your monthly fixed costs. You will know exactly when the unit stops burning cash and starts generating a return.

We have integrated industry-standard benchmarks for labor, food costs, and occupancy to help you sanity-check your projections. Comparing your estimated 14% food ingredient cost against typical bakery cafe performance helps identify if your margin assumptions are realistic or too aggressive. It acts as a financial guardrail for your business plan.


Simply purchase and download the financial model template, then access it instantly using Microsoft Excel or Google Sheets. No installation or technical expertise required-just open and start working.

Enter your business-specific numbers, including revenue projections, costs, and investment details. The pre-built formulas will automatically calculate financial insights, saving you time and effort.

Leverage the investor-ready format to confidently showcase your financial projections to banks, franchise representatives, or investors. Impress stakeholders with clear, data-driven insights and professional reports.

Leverage the investor-ready format to confidently present your projections to banks, franchise representatives, or investors.