
All-in-one Dashboard
Core inputs and core outputs


This franchise financial model template includes a retail franchise unit economic model Excel template and a comprehensive jewelry franchise store profitability guide to help you estimate operating expenses for luxury retail franchise units.
Core inputs and core outputs
Three scenario analysis
Presentation ready
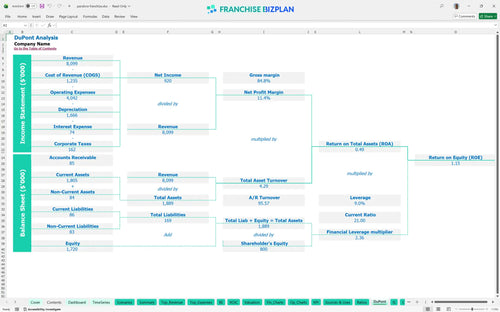
DuPont analysis
Researched revenue assumptions
Lender-friendly financial outputs
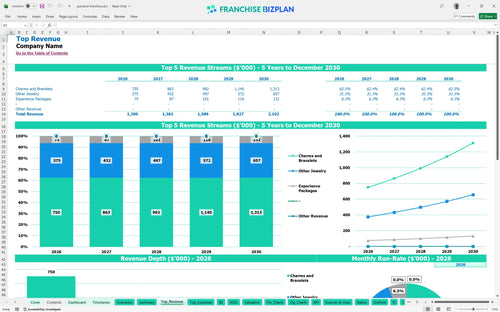
Revenue stream detailed view
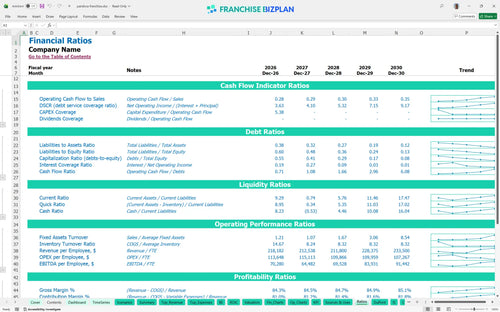
Performance metrics benchmark
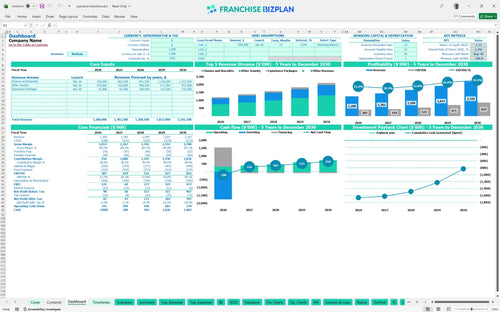
We built this jewelry franchise unit financial model using our own research on high-end retail performance and luxury unit economics. Key assumptions like the $1.2M year-one revenue and $387,000 EBITDA are pre-populated with researched data and are fully editable to fit your specific King Street or luxury corridor location. This model provides the business plan financial assumptions you need to move forward with confidence.
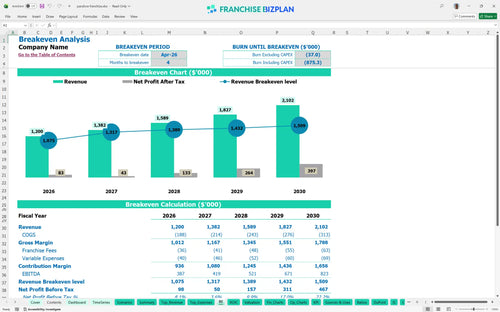
The unit hits its monthly break-even by April 2026 and shows a positive EBITDA of $387,000 in its first full year. While the store is profitable early on, the significant $1.75M startup cost means that full payback of your initial capital defintely happens after the fifth year of operation.
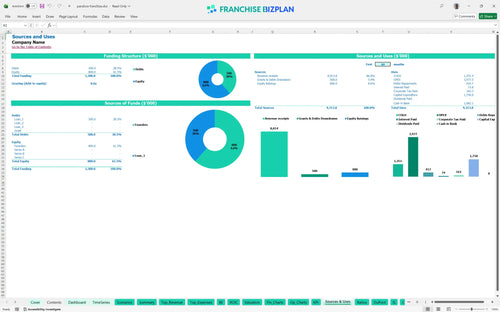
You will need approximately $1.75M to launch this jewelry franchise unit in the US. This covers the $350,000 franchise fee and $650,000 in leasehold improvements, plus you must account for a $310,000 cash dip during the ramp-up phase as you build local inventory and staff your team.
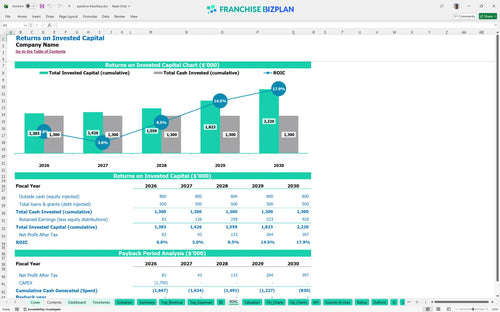
For this franchise ROI projection, the model shows an IRR of 1.26% and a Return on Equity of 1.15. Analyzing return on investment for franchise units reveals a steady income stream, with annual EBITDA growing to $823,000 by year five, though the high entry cost makes this a long-term equity play.
The store reaches its monthly break-even point in April 2026, just four months after opening. The primary driver is the $22,000 monthly rent for a prime location, meaning you need consistent foot traffic and a high average ticket from charms and bracelets to cover your fixed occupancy burden.
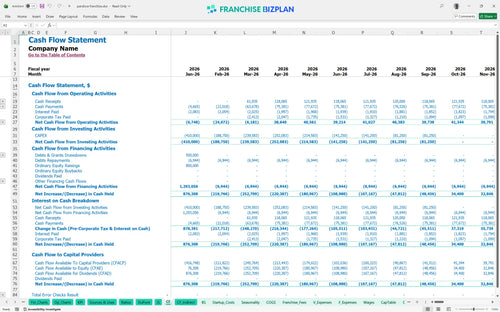
The lowest cash point occurs in September 2026 at -$310,000, requiring a solid cash runway to navigate the first nine months. We recommend using a retail franchise cash flow forecast template to ensure you have the liquidity to handle this peak capital need before the store reaches full maturity.
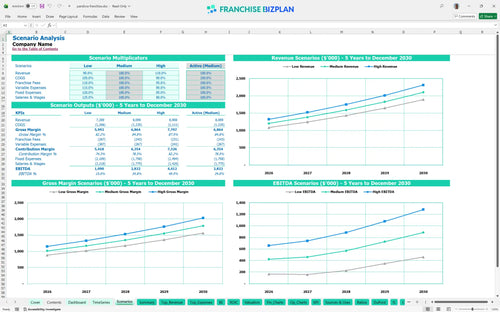
Our franchise financial projection spreadsheet for jewelry stores includes scenarios where revenue scales from $1.2M to $2.1M. Moving to a high-growth scenario improves your year-1 margin and accelerates the timing for reaching peak profitability, though your peak cash need remains tied to the initial $1.75M build-out.
Finance: update unit break-even and payback model by Friday.
This jewelry store financial model is built in Excel with fully editable assumptions and pre-filled formulas. You can easily adjust the jewelry franchise investment calculator to reflect your specific territory, local rent, and labor market conditions without breaking the underlying logic.

Plan your multi-unit growth or single-store exit with a detailed 5-year franchise profitability analysis. The model tracks revenue as it scales from $1.2M to over $2.1M, providing a clear view of how store-level EBITDA and cash flow evolve as the unit matures in its market.

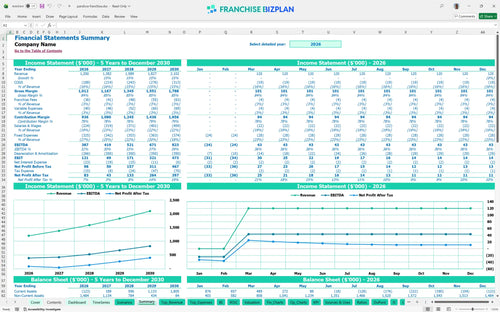
This tool specifically captures your brand-related financial obligations, including the $350,000 initial fee and the 3% marketing fund contribution. It ensures you understand the real-world economics of the jewelry franchise by subtracting these costs before calculating your take-home store-level margin.

Launching a high-end retail unit requires precise startup capital requirements planning. The model maps out your $1.75M initial investment and provides a clear break-even analysis, identifying the exact month your sales volume covers both fixed and variable operating costs.

We have incorporated luxury retail benchmarks to help you with operating expense forecasting. You can sanity-check your $22,000 monthly rent and 14.5% jewelry costs against industry standards, ensuring your financial feasibility study for retail franchise location sites is grounded in reality.


Simply purchase and download the financial model template, then access it instantly using Microsoft Excel or Google Sheets. No installation or technical expertise required-just open and start working.

Enter your business-specific numbers, including revenue projections, costs, and investment details. The pre-built formulas will automatically calculate financial insights, saving you time and effort.

Leverage the investor-ready format to confidently showcase your financial projections to banks, franchise representatives, or investors. Impress stakeholders with clear, data-driven insights and professional reports.

Leverage the investor-ready format to confidently present your projections to banks, franchise representatives, or investors.