
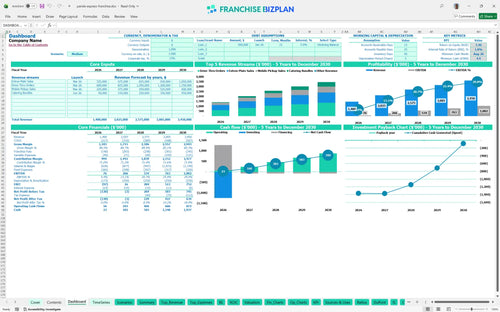
All-in-one Dashboard
Core inputs and core outputs


This restaurant franchise financial model Excel template provides a complete toolkit for analyzing unit-level performance from day one through year five.
Core inputs and core outputs
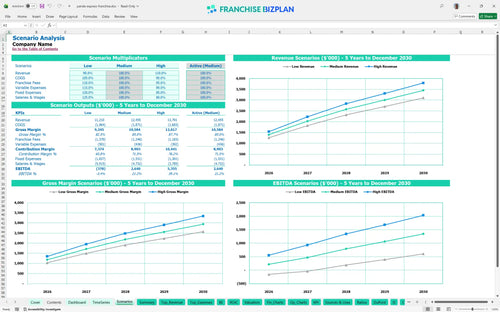
Three scenario analysis
Presentation ready
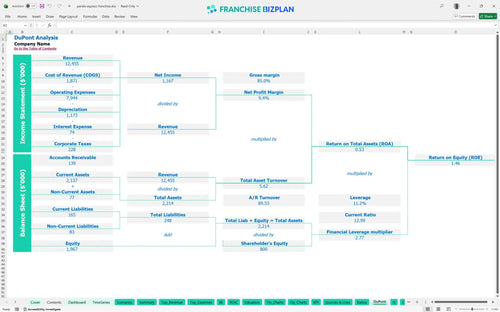
DuPont analysis
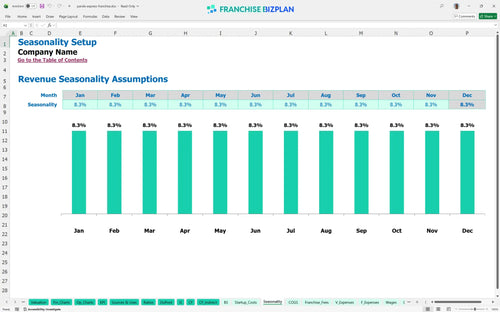
Researched revenue assumptions
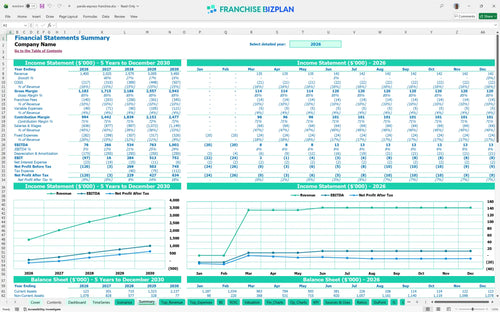
Lender-friendly financial outputs
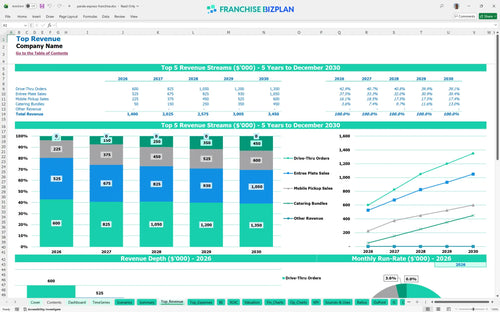
Revenue stream detailed view
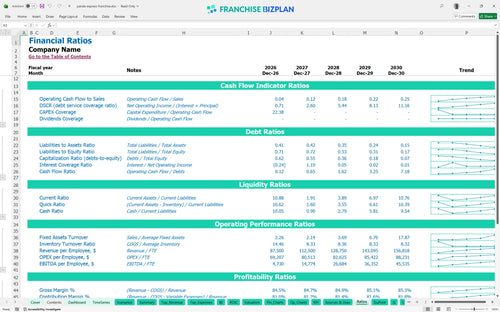
Performance metrics benchmark
We built this franchise unit financial model using our own research on this specific QSR concept. Key assumptions like the $1.4 million Year 1 revenue and the $1.25 million initial investment are pre-populated and fully editable. You can tweak everything from the 8% royalty to the $18,000 monthly rent to see how your specific site performs.
The model shows this unit hits EBITDA (earnings before interest, taxes, depreciation, and amortization) positive in Year 1 with $76,000 in earnings. But honestly, real bottom-line profitability depends on how fast you scale from the initial $350,000 in entree sales to the Year 5 target of $700,000. Scaling to $3.45 million in sales by Year 5 is the real goal here.
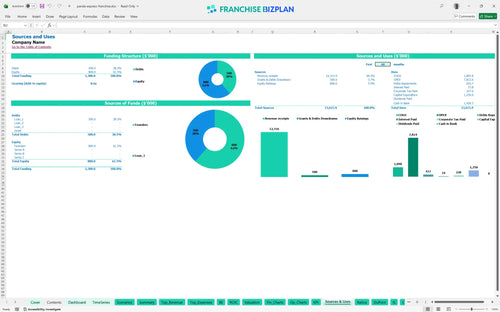
You need $1,250,000 to get this unit off the ground, which makes it a significant quick service restaurant investment calculator exercise. This includes a $25,000 franchise fee and a heavy $600,000 investment in leasehold improvements (renovating the physical space) plus $250,000 for kitchen gear. Speeding up the build-out is the best way to save your capital.
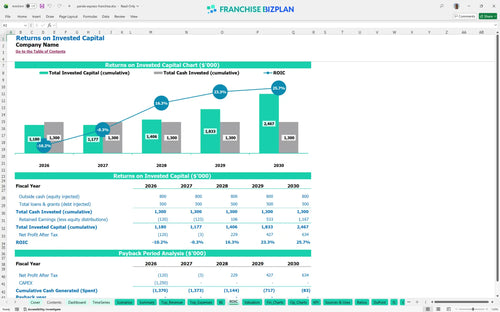
Evaluating franchise unit return on investment shows an IRR (internal rate of return, or the annual rate of growth an investment generates) of 1.75% and a payback period extending past Year 5. This is a long-term play where you defintely rely on the Year 5 EBITDA of $1,002,000 to recover that initial million-dollar-plus spend. This is a marathon, not a sprint, given the 5-year payback.
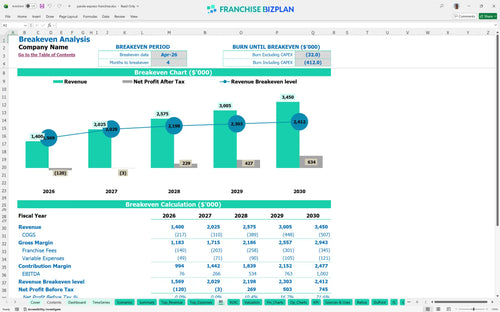
You hit the break-even point in April 2026, just four months after opening. This quick jump to covering monthly costs is driven by the high-volume drive-thru, which starts at $400,000 in Year 1 and is the biggest lever for covering the $18,000 monthly rent. Efficiency in the drive-thru lane is your fastest path to black ink.
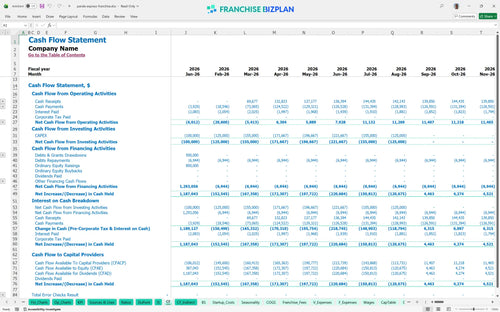
Your lowest cash point hits in August 2026 at just $5,000, which doesn't leave much room for error. You'll need a solid restaurant business plan financial projections strategy to manage the gap between the $1.25M spend and the ramp-up of the $150,000 mobile pickup revenue. A $5,000 cash floor means you need to watch every penny in 2026.
Financial forecasting for new restaurant locations requires looking at how a 10% drop in traffic affects your $1.4M Year 1 baseline. In a high-growth scenario where catering bundles hit $450,000 by Year 5 instead of $50,000, your ROI (return on investment) shifts from a slow burn to a cash machine. Small wins in local marketing can shift your entire ROI profile.
Finance: update unit break-even and payback model by Friday
This franchise financial model is built in Excel with a focus on flexibility, so you can adjust every variable to fit your specific territory. It functions as a fast food franchise business plan tool where you can swap out pre-filled data for your own local numbers. Whether you are adjusting operating expenses or changing the opening date, the logic stays intact. Every cell is open, so you aren't locked into our math.

Success in a high-volume QSR concept requires a long-term view, and this model provides detailed QSR financial projections through year five. You can track how revenue grows from $1.4 million in the first year to over $3.4 million by year five. This projected income statement for franchise business owners includes a full franchise investment analysis to help you see the big picture. Growth isn't a straight line, but this model helps you map the curve.

Managing the relationship with the franchisor means staying on top of your Franchise P&L statement and recurring fees. This model includes a built-in franchise royalty fee calculator that handles the 8% royalty and 2% marketing fund contributions automatically. It simplifies calculating franchise royalty and advertising fees so you know exactly how much cash stays in your pocket after the brand takes its cut. The franchisor gets their cut off the top, so you need to know what's left.

Before you flip the sign to open, you need to know how to calculate startup costs for a fast food franchise accurately. This model aggregates your $1.25 million initial investment and provides a clear break-even point analysis to show when you stop burning cash. It breaks down the $600,000 in leasehold improvements and $250,000 in kitchen equipment so you can see your total exposure. Knowing your number helps you sleep better during the ramp-up.

We have integrated a franchise unit operational cost breakdown based on real-world QSR standards to help you sanity-check your budget. This fast food unit profitability analysis uses benchmarks for labor, like the $85,000 general manager salary, and occupancy costs like the $18,000 monthly rent. It helps you identify if your COGS (cost of goods sold, which is basically your food and packaging) are out of line with the 15.5% target. Don't fly blind when you can use proven QSR standards.


Simply purchase and download the financial model template, then access it instantly using Microsoft Excel or Google Sheets. No installation or technical expertise required-just open and start working.

Enter your business-specific numbers, including revenue projections, costs, and investment details. The pre-built formulas will automatically calculate financial insights, saving you time and effort.

Leverage the investor-ready format to confidently showcase your financial projections to banks, franchise representatives, or investors. Impress stakeholders with clear, data-driven insights and professional reports.

Leverage the investor-ready format to confidently present your projections to banks, franchise representatives, or investors.