
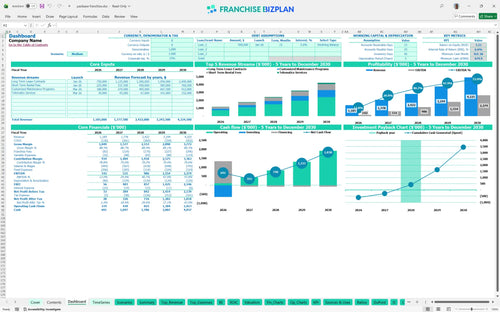
All-in-one Dashboard
Core inputs and core outputs


This franchise unit financial model template provides a data-driven framework for forecasting revenue, managing high-value assets, and analyzing the long-term ROI of a commercial truck leasing and service center.
Core inputs and core outputs
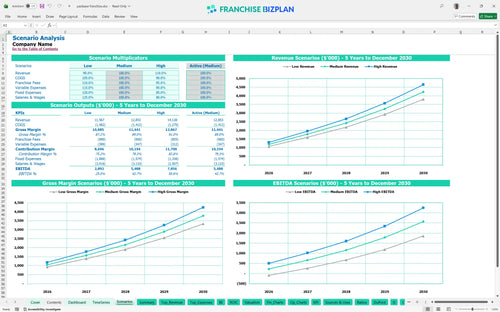
Three scenario analysis
Presentation ready
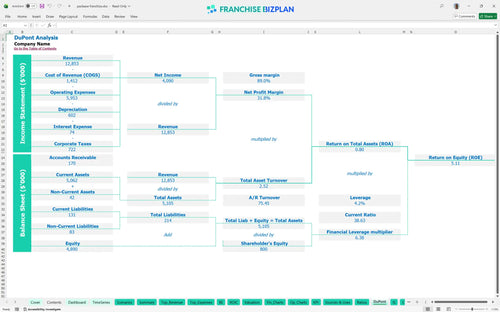
DuPont analysis
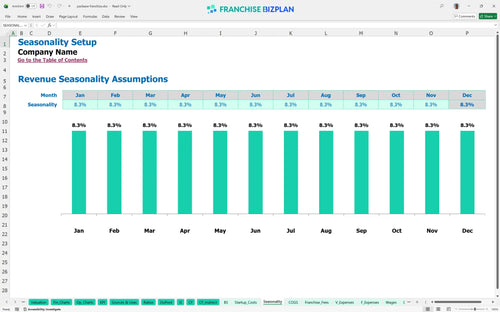
Researched revenue assumptions
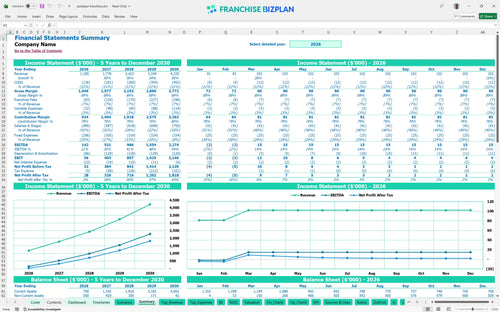
Lender-friendly financial outputs
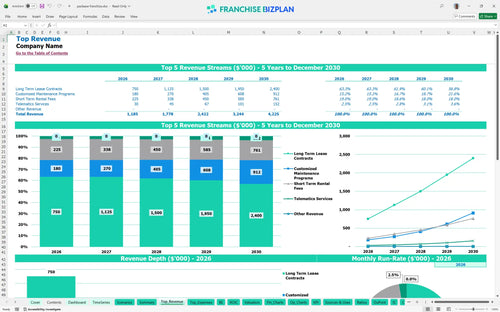
Revenue stream detailed view
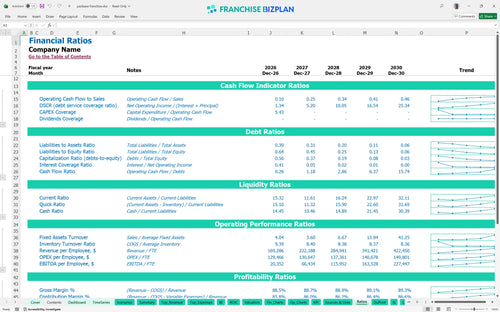
Performance metrics benchmark
We built this logistics franchise investment analysis using detailed research into the commercial truck leasing sector. The model includes pre-populated assumptions for revenue streams like long-term leases and telematics, alongside specific costs for diesel technicians and facility improvements, all of which you can defintely edit. With a Year 1 revenue target of $1,185,000 and a 3-year payback period, this tool provides a realistic roadmap for prospective owners. This is the exact framework you need to move from a business idea to a funded operation.
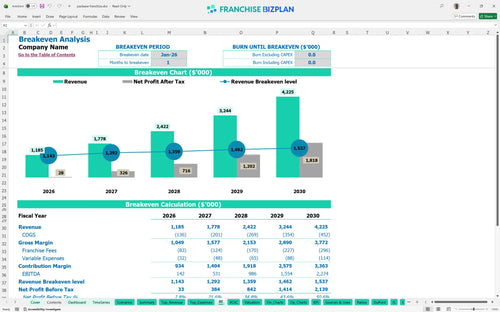
The franchise unit reaches profitability almost immediately, with a break-even date of January 2026, though true scale arrives in Year 3 when EBITDA hits $986,000. By Year 5, the model projects an EBITDA of $2,274,000 as long-term lease contracts and maintenance programs compound. Here's the quick math: recurring revenue is the engine that drives your 6.63% IRR.
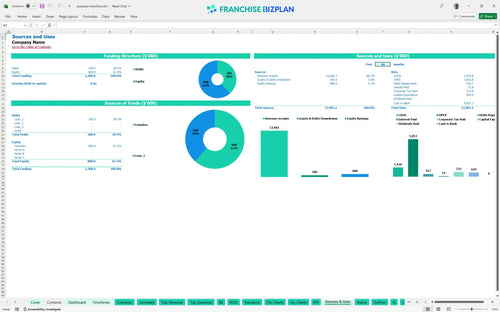
You need approximately $644,000 in upfront CAPEX to launch this unit, covering everything from the $4,000 franchise fee to the $250,000 facility leasehold improvements. This total does not include your initial fleet acquisition, but it covers the $150,000 in service bay equipment and $80,000 for the office fitout. You will also need to maintain a minimum cash buffer of $680,000 to handle the ramp-up phase safely.
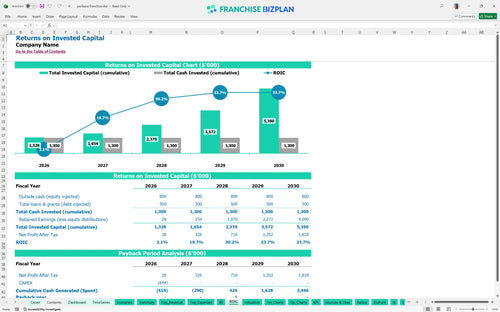
Investors can expect an Internal Rate of Return (IRR) of 6.63% and a Return on Equity (ROE) of 5.11% over the initial five-year period. The model shows a 3-year payback period, which is standard for asset-heavy logistics franchises with high initial build-out costs. What this estimate hides is the potential for higher returns if you secure multi-unit density in a high-traffic port area.
The monthly break-even point is reached in the first month of operation, January 2026, assuming you launch with a baseline of long-term lease contracts. The primary driver for break-even is fleet utilization and managing the 9% fleet depreciation cost against your fixed $15,000 monthly rent. If lease volume lags, your high fixed labor costs for managers and technicians will quickly pressure your cash position.
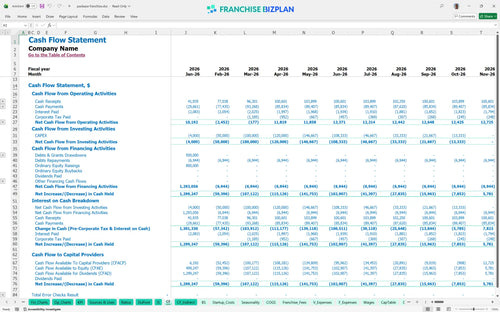
The lowest cash point occurs in October 2026, with a minimum cash balance of $680,000, which suggests you need significant liquidity beyond the initial startup costs. This dip reflects the timing of hiring additional support staff and the lag in maintenance program revenue. We recommend a healthy cash buffer to protect against any delays in facility improvements or IT network setup.
In the High scenario, increasing your telematics and maintenance revenue by just 10% can accelerate your Year 5 EBITDA well beyond the $2.2M baseline. Conversely, a Low scenario with 15% lower lease volume significantly extends the payback period and increases the peak cash need in Year 1. The model allows you to stress-test these variables to see how sensitive your ROI is to local market demand and pricing.
This franchise financial model template is a flexible Excel tool designed to help you map out the specific economics of a heavy-duty truck leasing operation. It features pre-filled formulas and editable assumption cells, so you can adjust everything from fleet size to local labor rates without breaking the logic. Whether you are looking at a single territory or a multi-unit expansion, the model adapts to your specific site selection and local demand profile. Here is the quick math: you control the inputs, and the model handles the complex depreciation and royalty calculations. One clean model solves a hundred messy spreadsheets.

Success in the commercial truck leasing business plan requires looking past the first year to see how fleet scaling impacts your bottom line. This model provides a detailed 5-year outlook, showing how revenue grows from an initial $1,185,000 to over $4,225,000 as your lease portfolio matures. It tracks the timing gaps between high upfront capital expenditure (CAPEX) and the steady cash flow from long-term contracts. Still, you need to watch the out-years to ensure your maintenance margins stay ahead of fleet aging. Long-term planning is the only way to survive the capital-intensive ramp-up phase.

Operating within a global network means managing specific brand obligations like the 6% royalty and 1% marketing fund contribution. This model automatically calculates these fees against your projected revenue streams, including long-term leases and short-term rentals, so you see the true net margin. It captures the $4,000 initial franchise fee and ensures your local marketing spend is layered correctly on top of brand-level requirements. Understanding these 'off-the-top' costs is vital for accurate store-level EBITDA (earnings before interest, taxes, depreciation, and amortization) forecasting. Every margin point counts when you are scaling a fleet.

Calculating how to calculate startup costs for a truck leasing franchise involves more than just the franchise fee; you must account for facility improvements and service equipment. This model aggregates your $250,000 build-out costs and $150,000 service bay investments to determine exactly when your monthly revenue covers both fixed and variable expenses. It provides a clear view of the $15,000 monthly rent and $31,500 in total monthly fixed costs that define your floor. Knowing your break-even revenue helps you set realistic sales targets for your team from day one. Speed to break-even is the most important metric for your first six months.

This trucking franchise profit and loss template includes built-in benchmarks to help you sanity-check your operational assumptions against industry standards. You can compare your 2.5% maintenance parts cost or your 9% fleet depreciation against typical commercial vehicle leasing margins to ensure your plan is realistic. It helps you evaluate if your staffing plan, including a $110,000 General Manager salary, aligns with high-performing logistics franchise investment analysis. If your labor or rent percentages drift too far from the norm, the model flags it for review. Use these benchmarks to build a credible case for lenders or partners.


Simply purchase and download the financial model template, then access it instantly using Microsoft Excel or Google Sheets. No installation or technical expertise required-just open and start working.

Enter your business-specific numbers, including revenue projections, costs, and investment details. The pre-built formulas will automatically calculate financial insights, saving you time and effort.

Leverage the investor-ready format to confidently showcase your financial projections to banks, franchise representatives, or investors. Impress stakeholders with clear, data-driven insights and professional reports.

Leverage the investor-ready format to confidently present your projections to banks, franchise representatives, or investors.