
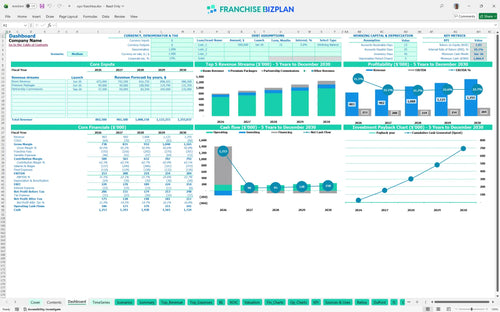
All-in-one Dashboard
Core inputs and core outputs


This financial model for small hotel franchise unit provides a complete toolkit for analyzing startup costs, 5-year operational performance, and investor returns in a single, integrated spreadsheet.
Core inputs and core outputs
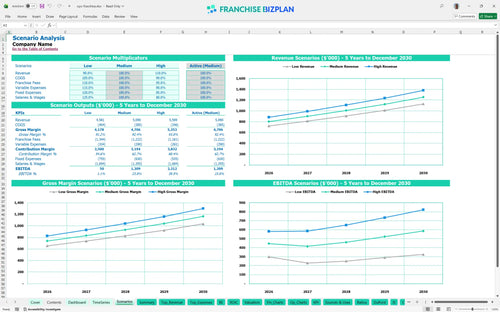
Three scenario analysis
Presentation ready
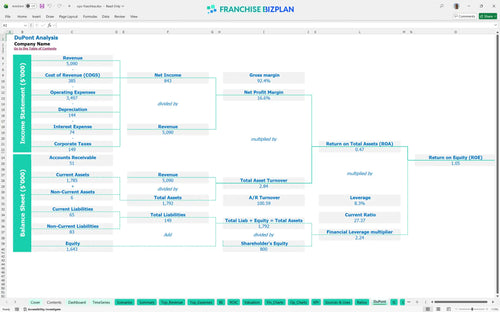
DuPont analysis
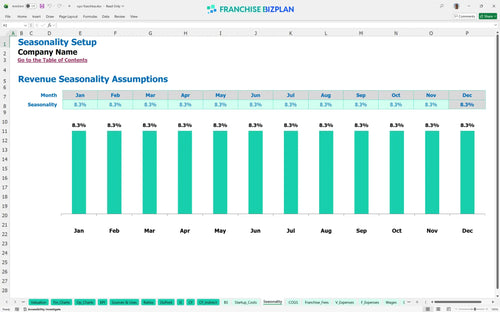
Researched revenue assumptions
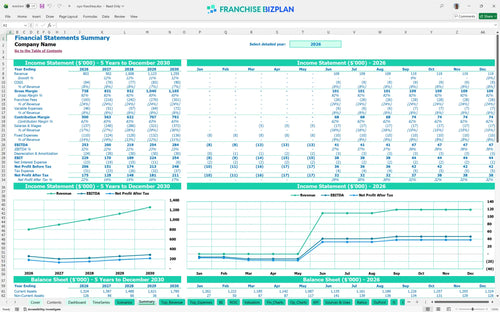
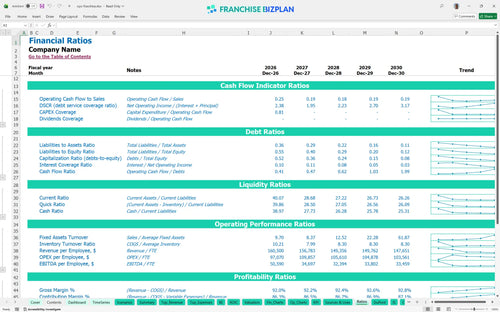
Lender-friendly financial outputs
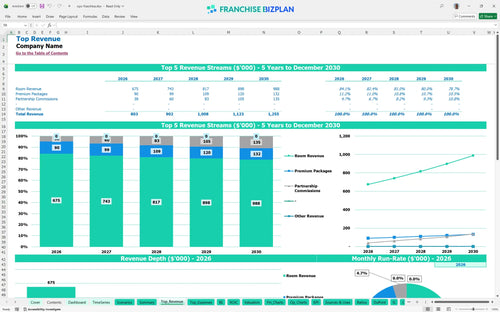
Revenue stream detailed view
Performance metrics benchmark
We built this hospitality franchise profitability analysis using detailed research into budget lodging performance and standardized brand requirements. Key assumptions, including room revenue, 22% royalty fees, and housekeeping payroll, are pre-populated based on Nashville-area market data and are fully editable to match your specific site. This tool allows you to see how a $253,000 year-one EBITDA translates into actual take-home cash after debt service and taxes.
The unit shows immediate operational strength with a year-one EBITDA of $253,000, though net profitability depends on your debt structure and the speed of the 6-month ramp-up. Hospitality revenue management is critical here, as revenue is projected to grow from $803,000 to $1,255,000 by year five. Analyzing hotel franchise profitability and operating margins shows that while royalties are high, the lean staffing model helps protect the bottom line.
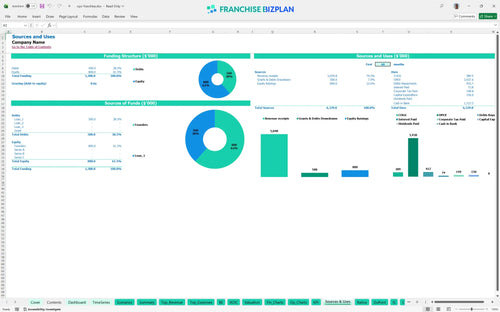
You will need approximately $150,000 in upfront capital for the physical build-out and brand entry, plus a significant cash buffer for the initial months. This investment covers the $25,000 franchise fee, $45,000 for room renovations, and $18,000 for the property management system budget and tech install. Estimating revenue for tourist destination hotel location suggests that having this capital ready for a June launch aligns with peak seasonal demand.
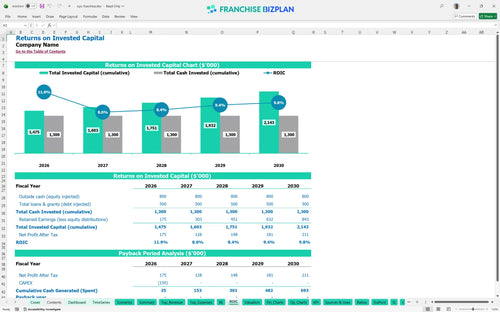
This franchise ROI analysis indicates an Internal Rate of Return (IRR) of 10.06% and a Return on Equity (ROE) of 1.05. While the years to payback extend beyond the 5-year window due to high initial royalties, the franchise unit economic performance spreadsheet shows steady cash flow growth. Investors should focus on the long-term asset value and the consistent EBITDA growth, which reaches $284,000 by the fifth year of operation.
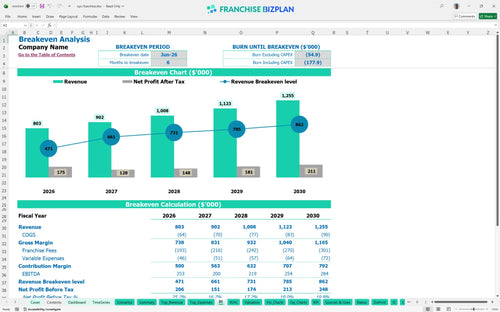
The model projects a break-even date of June 2026, exactly 6 months after the initial investment phase begins. Reaching this point depends heavily on hitting the $450,000 first-year room revenue target while keeping fixed costs like the $6,000 monthly rent stable. Return on investment for budget hotel franchise units is highly sensitive to occupancy rates during this critical 6-month window.
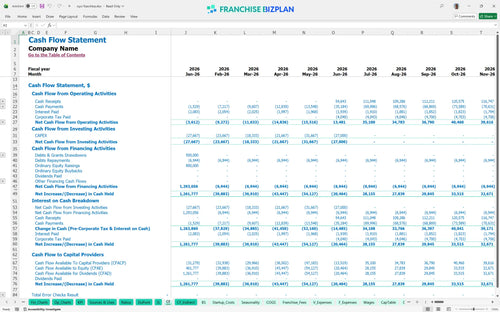
The lowest cash point is projected at $1,067,000 in June 2026, which includes your initial investment and operating losses during the start-up phase. Budgeting for contactless hotel operations and technology helps keep the payroll lean, but you defintely need to maintain a reserve for seasonal dips. A hospitality franchise cash flow forecasting model is essential to ensure you don't run dry before the partnership commissions start contributing in year one.
This franchise financial feasibility study template allows you to toggle between Low, Medium, and High scenarios to see how a 10% drop in occupancy affects your $253,000 EBITDA. In a high-performance scenario, increasing partnership commissions from $25,000 to $90,000 over five years significantly improves the unit's valuation. Still, even in a low scenario, the fixed property rent of $72,000 per year remains your biggest hurdle to clear.
Finance: update unit break-even and payback model by Friday.
This hotel franchise financial model is a flexible Excel-based tool designed to help you stress-test the numbers before signing a long-term agreement. It features pre-filled formulas and editable assumptions, making it easy to adjust room rates, occupancy targets, and local labor costs to fit your specific market. This hotel franchise financial projection template excel allows you to swap out generic estimates for real-world quotes from local contractors and vendors.

Success in hospitality requires looking beyond the grand opening to understand how the unit performs over a full business cycle. This hotel business plan template provides a detailed 5-year outlook, mapping out revenue growth from $803,000 in year one to over $1.25 million by year five. You can track how rising housekeeping needs and maintenance costs impact your long-term cash flow and balance sheet health as the property matures.

Operating a branded hotel comes with significant ongoing obligations that can squeeze your margins if not managed tightly. This franchise investment calculator specifically accounts for a 22% royalty fee and a 2% marketing fund contribution, ensuring you see the impact of these costs on every dollar of room revenue. By modeling the franchise fee structure upfront, you can determine if the brand's dynamic pricing and booking platform generate enough volume to justify the high fee percentage.

Launching a hospitality unit requires a clear understanding of your total 'keys-in-hand' cost, including renovations and tech stacks. Use this franchise startup cost spreadsheet to estimate the $150,000 initial capital outlay, covering everything from the $25,000 franchise fee to $45,000 in room renovations. Knowing how to calculate startup costs for a hotel franchise is the first step toward determining the monthly occupancy levels needed to cover your $6,000 monthly rent and fixed utilities.

Our model includes built-in hotel operational expenses and benchmarks to ensure your projections stay grounded in reality. You can compare your projected guest amenity costs, currently modeled at 4.5% of revenue, against industry standards to identify potential margin leaks. These benchmarks help you evaluate if your staffing plan, including a $55,000 General Manager salary, aligns with typical budget hotel performance metrics.


Simply purchase and download the financial model template, then access it instantly using Microsoft Excel or Google Sheets. No installation or technical expertise required-just open and start working.

Enter your business-specific numbers, including revenue projections, costs, and investment details. The pre-built formulas will automatically calculate financial insights, saving you time and effort.

Leverage the investor-ready format to confidently showcase your financial projections to banks, franchise representatives, or investors. Impress stakeholders with clear, data-driven insights and professional reports.

Leverage the investor-ready format to confidently present your projections to banks, franchise representatives, or investors.