
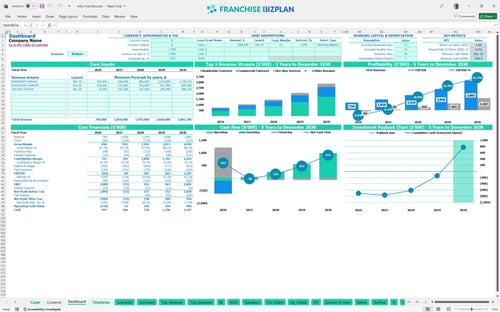
All-in-one Dashboard
Core inputs and core outputs


This financial forecasting tool includes a complete set of pro forma statements, startup cost trackers, and scenario builders designed specifically for service-based franchise owners.
Core inputs and core outputs
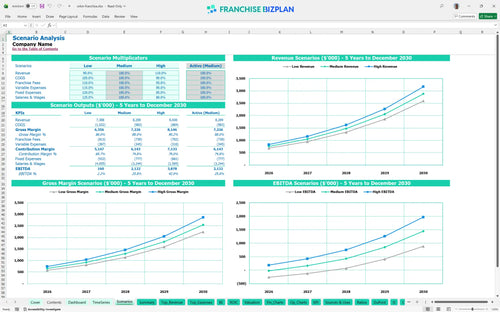
Three scenario analysis
Presentation ready
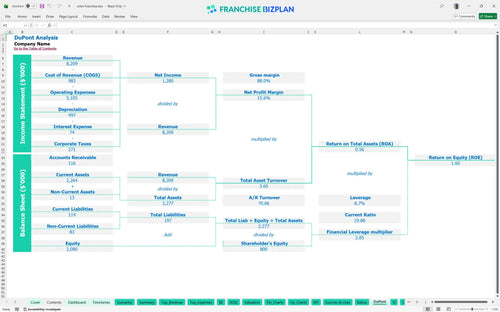
DuPont analysis
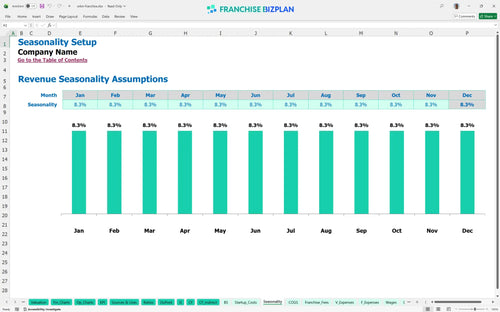
Researched revenue assumptions
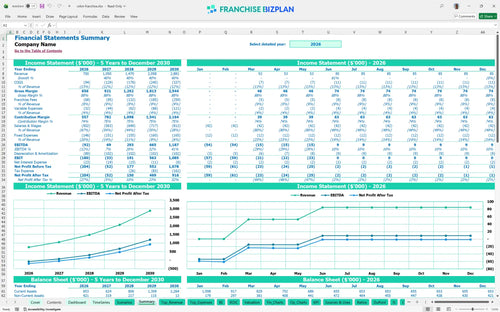
Lender-friendly financial outputs
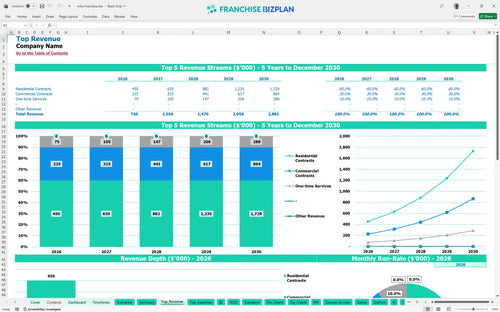
Revenue stream detailed view
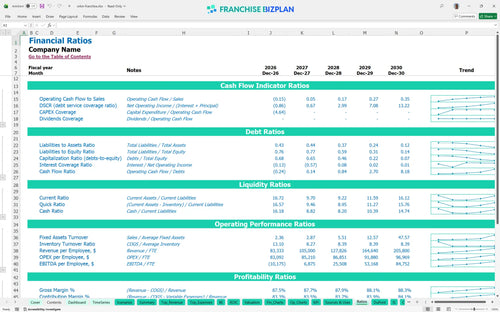
Performance metrics benchmark
We built this pest control business financial model excel template using deep research into the service sector to provide a realistic starting point. The model includes pre-populated data for $750,000 in year-one revenue and a $510,000 initial asset build-out, but you can edit every cell to fit your local Austin or Round Rock market reality. It is a practical tool for any owner who wants to move past guesswork and start managing by the numbers.
The unit is projected to hit positive EBITDA in Year 2, generating approximately $69,000 after a Year 1 ramp-up loss. Profitability depends on scaling residential contracts from $300,000 to over $420,000 while keeping the 7% royalty and 2% marketing fees in check. By Year 5, the model shows a significant jump to $1.18M in EBITDA as recurring revenue compounds.
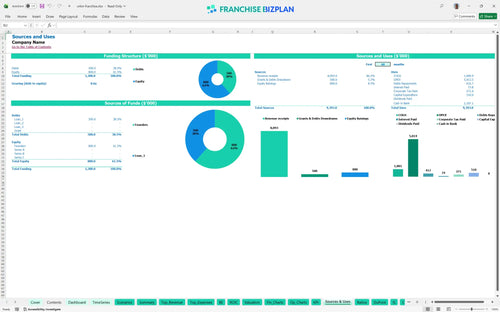
You will need approximately $510,000 for the initial launch, covering everything from the franchise fee to your service fleet. This doesn't include the working capital needed to cover the $92,000 EBITDA loss in the first year. The model tracks these sources and uses to ensure you don't run out of cash before the July 2026 break-even date.
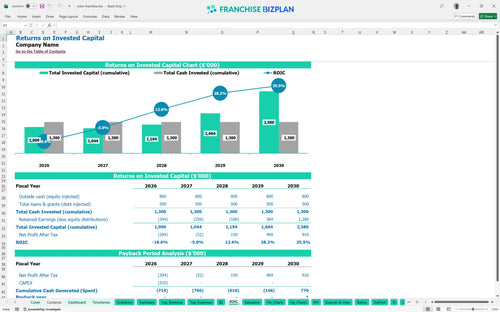
The model estimates an Internal Rate of Return (IRR) of 2.55% and a Return on Equity (ROE) of 1.6 over the five-year period. While the first few years are heavy on reinvestment, the 5-year payback period is typical for a high-CapEx service business. The real value sits in the Year 5 exit potential when revenue hits $2.88M with healthy margins.
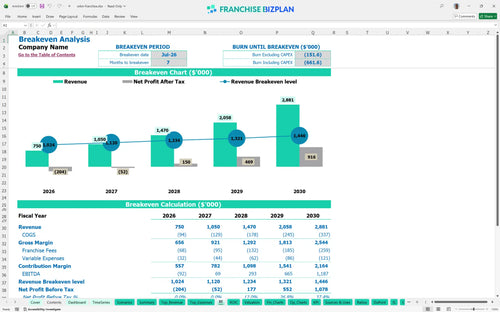
Break-even is expected in July 2026, roughly seven months after the initial launch. This quick turn is possible because of the recurring revenue business model, but it requires hitting $300,000 in residential sales in the first year. The biggest drag on your break-even timing will be the fixed costs, specifically the $6,500 monthly warehouse rent and the $283,000 initial management salary load.
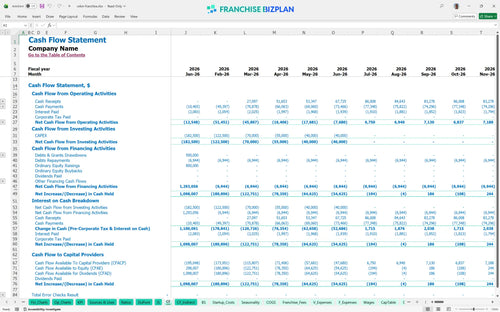
The lowest cash point occurs in December 2027, with a projected minimum cash balance of $566,000. This suggests you need a solid capital cushion to handle the timing gaps between hiring technicians and collecting on commercial contracts. To be fair, if your commercial collections lag by 30 days, your cash pressure will rise defintely during the Year 2 expansion.
The difference between a Low and High scenario in this model usually comes down to technician productivity and contract retention. In the High case, where revenue scales to $2.88M by Year 5, your store-level margin expands because fixed costs like rent and management salaries stay relatively flat. If sales miss by 20%, the 5-year payback period could easily stretch to 7 or 8 years.
Finance: update unit break-even and payback model by Friday
This franchise financial model template is built in Excel so you can tweak every variable to match your specific territory. It comes pre-loaded with formulas and editable assumptions for revenue drivers, staffing, and local overhead, making it easy to simulate different growth paths. You can adjust the numbers to see how local rent or higher technician wages impact your bottom line before you sign a lease.

Planning a pest control business requires a long-term view of how recurring contracts stack up over time. This model provides detailed 5-year projections for revenue, cash flow, and profit, helping you visualize the transition from a startup to a mature unit. By mapping out operating expense forecasting over sixty months, you can defintely see when the scale of your fleet starts to drive significant EBITDA growth.

Franchise royalty fees and brand fund contributions are non-negotiable costs that eat into your store-level margin. This tool automatically calculates the 7% royalty and 2% marketing fund based on your gross sales, so you always know your net position. It captures the initial $100,000 franchise fee and ongoing obligations to ensure your unit economics analysis reflects the true cost of the brand's support.

Using a franchise unit startup cost calculator helps you avoid the common trap of undercapitalization. This model breaks down the $510,000 in initial capital expenditures, from service vehicles to IT systems, and identifies exactly when you stop burning cash. Knowing your break-even sales level is vital for managing your early-stage runway and setting realistic sales targets for your team.

We have baked in industry-standard benchmarks for labor, chemicals, and fuel to help you sanity-check your projections. If your pest control chemicals are running way higher than the 10% target, the model flags it so you can investigate waste or pricing issues. This service-based franchise financial projection ensures your small business franchise profitability analysis stays rooted in real-world operational limits.


Simply purchase and download the financial model template, then access it instantly using Microsoft Excel or Google Sheets. No installation or technical expertise required-just open and start working.

Enter your business-specific numbers, including revenue projections, costs, and investment details. The pre-built formulas will automatically calculate financial insights, saving you time and effort.

Leverage the investor-ready format to confidently showcase your financial projections to banks, franchise representatives, or investors. Impress stakeholders with clear, data-driven insights and professional reports.

Leverage the investor-ready format to confidently present your projections to banks, franchise representatives, or investors.