
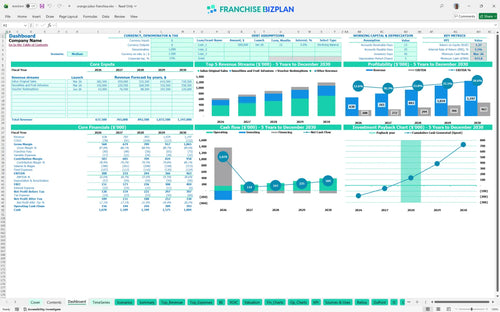
All-in-one Dashboard
Core inputs and core outputs


This mall kiosk business financial planning tool provides a complete Excel template for franchise unit financial forecasting, including a detailed franchise P&L statement and ROI metrics.
Core inputs and core outputs
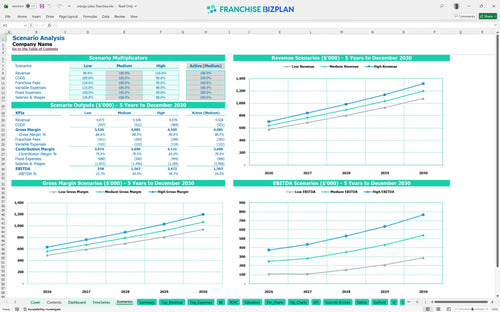
Three scenario analysis
Presentation ready
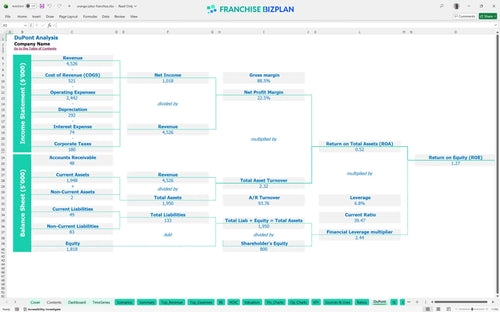
DuPont analysis
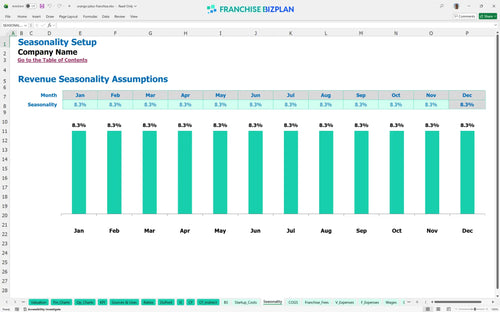
Researched revenue assumptions
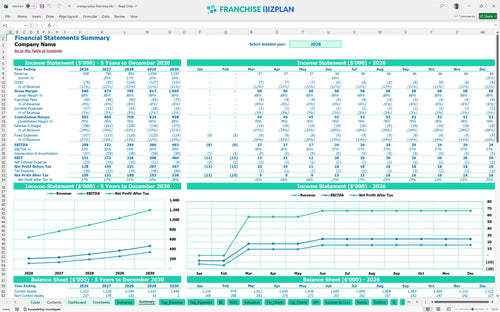
Lender-friendly financial outputs
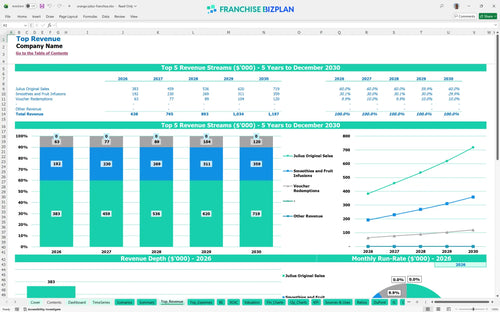
Revenue stream detailed view
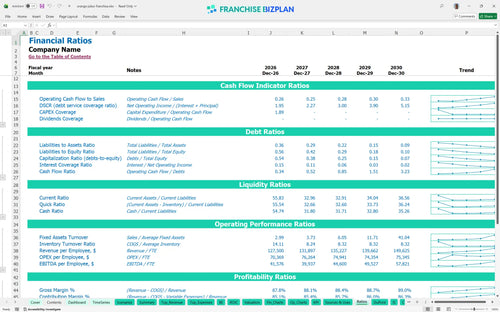
Performance metrics benchmark
We developed this financial model for beverage franchise startup analysis using deep research into mall-based unit economics. The pre-filled data covers everything from $5,800 monthly rent to specific staffing needs for brand ambassadors, starting with $638,000 in Year 1 revenue. These assumptions are fully editable to fit your specific territory.
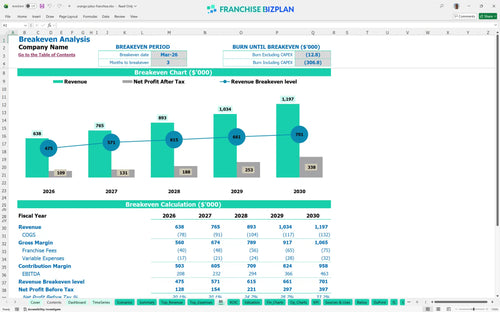
Your unit hits profitability fast, reaching break-even in just 3 months by March 2026. With Year 1 EBITDA at $208,000, the model shows a strong climb as you optimize beverage ingredient costs and scale voucher redemptions. Here is the quick math: high margins on signature drinks drive the bottom line once you clear the fixed mall lease costs.
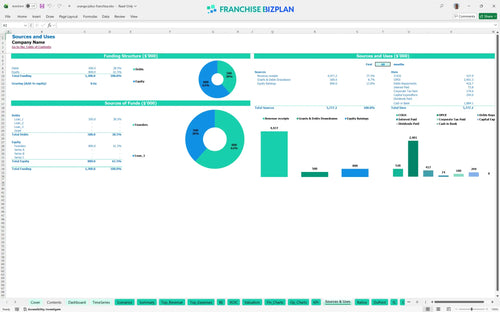
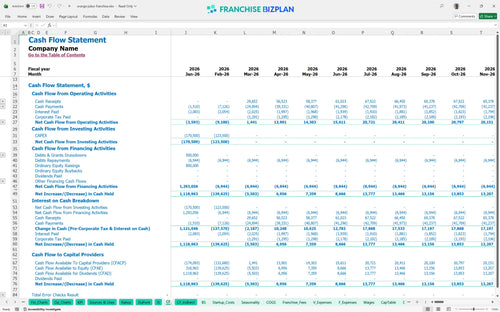
You need $294,000 to get this kiosk off the ground in a US mall. This covers the $25,000 franchise fee and significant physical assets like the $130,000 build-out and $65,000 in specialized blending equipment. The model also accounts for a healthy cash buffer, with minimum cash hitting $974,000 during the initial ramp-up phase. Here is how to calculate startup costs for a mall kiosk using our data.
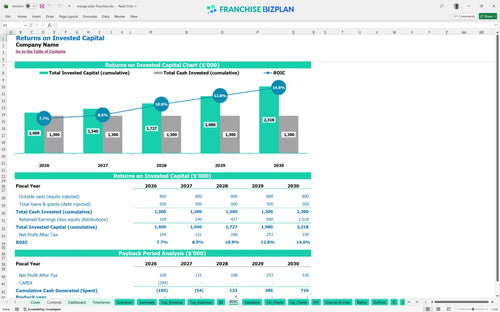
Investors can expect a 5.51% IRR and a 3-year payback period on the initial capital outlay. While the ROE stands at 1.27, the real value lies in the steady cash flow growth, with EBITDA more than doubling by Year 5. This franchise ROI calculator approach shows that high-traffic locations justify the upfront build-out costs through consistent daily volume.
The unit reaches break-even in March 2026, just three months after launching. This rapid turnaround depends on hitting your Year 1 sales target of $638,000 while managing the $5,800 monthly rent and 5% royalty burden. To be fair, the main driver here is throughput; you need consistent foot traffic to cover the fixed mall overhead quickly.
Your lowest cash point occurs in March 2026 at $974,000, which includes your initial capitalization. This shows a very safe runway, but a franchise feasibility study should always account for delays in mall construction. If your opening slips by 60 days, your pre-opening labor and rent will eat into this buffer, though the model liquidity remains robust.
The High scenario assumes better local marketing execution, pushing Year 1 revenue past the $638,000 baseline. A Low scenario, perhaps due to lower mall occupancy, would stretch the 3-year payback and tighten the 1.27 ROE. This financial forecasting template for franchise owners allows you to stress-test how a 10% drop in traffic affects your ability to cover the $1,100 monthly utility bill.
This franchise financial model template is built in Excel to give you total control over your unit's future. Every formula is open, so you can adjust beverage mix, seasonal traffic spikes, or mall-specific lease terms without breaking the logic. It is a flexible tool designed for a financial model for beverage franchise startup that needs to move as fast as the lunch rush.

Planning a retail franchise financial projection requires looking past the grand opening. This model tracks your growth from $638,000 in year one to nearly $1.2M by year five, accounting for ramp-up and market maturity. You get a clear view of how increasing your brand ambassador count from 1.5 to 2.7 FTEs impacts your bottom line over time.

Estimating franchise royalty fees in financial projections is critical because these costs come off the top. We have modeled a 5% royalty and a 1.25% marketing fee to ensure your unit economics model reflects the true cost of brand support. This helps you see exactly how much cash stays in your pocket after the franchisor takes their cut of your smoothie and infusion sales.

Using a franchise startup cost calculator is the only way to avoid mid-build surprises. This tool maps out your $294,000 initial investment, from the $130,000 kiosk build-out to the $25,000 entry fee. Calculating break-even point for retail franchise unit operations becomes simple when you can see the exact moment your high-margin beverage sales cover your $5,800 monthly mall rent.

Our franchise profitability analysis includes benchmarks for labor and COGS to keep your plan realistic. For instance, beverage ingredients are modeled to drop from 10.5% to 9.3% as you gain scale and reduce waste. These numbers help you defintely verify if your operating expense forecast aligns with high-performing mall kiosks in similar markets.


Simply purchase and download the financial model template, then access it instantly using Microsoft Excel or Google Sheets. No installation or technical expertise required-just open and start working.

Enter your business-specific numbers, including revenue projections, costs, and investment details. The pre-built formulas will automatically calculate financial insights, saving you time and effort.

Leverage the investor-ready format to confidently showcase your financial projections to banks, franchise representatives, or investors. Impress stakeholders with clear, data-driven insights and professional reports.

Leverage the investor-ready format to confidently present your projections to banks, franchise representatives, or investors.