

All-in-one Dashboard
Core inputs and core outputs


This financial model provides a complete roadmap for HVAC service success, integrating revenue streams, payroll for a full technical team, and detailed CAPEX schedules.
Core inputs and core outputs
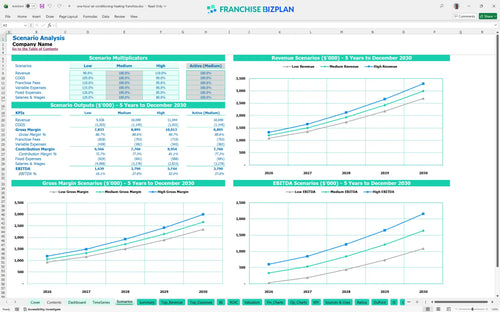
Three scenario analysis

Presentation ready
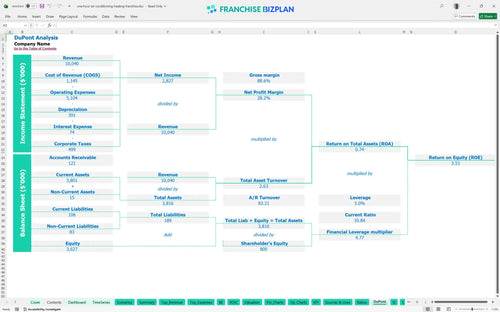
DuPont analysis
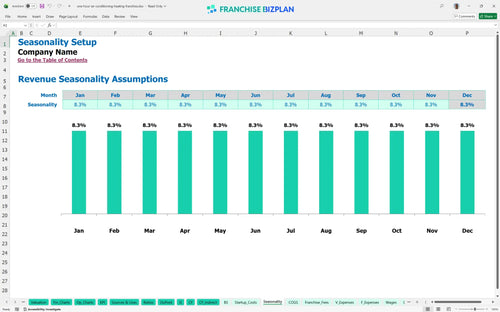
Researched revenue assumptions

Lender-friendly financial outputs
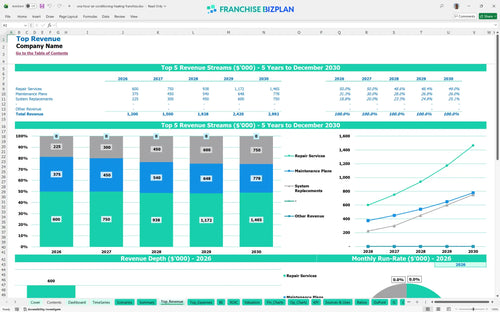
Revenue stream detailed view

Performance metrics benchmark
We built this HVAC franchise financial model using our own research into the residential service sector to ensure the numbers reflect actual field operations. Key assumptions like the $1.2M year-one revenue target and the specific $55,000 annual salary for technicians are pre-populated and fully editable to match your local market reality. Honestly, having a data-driven starting point is the only way to avoid the common trap of underestimating your initial working capital needs.
This unit hits the ground running with a projected $238,000 EBITDA in year one, scaling to $1.4M by year five as you build your maintenance plan base. You defintely reach profitability early because the model assumes a quick ramp-up in repair services and system replacements to offset the 7.5% total royalty and marketing load.
You will need roughly $406,000 in startup capital to cover the initial build-out and equipment needs. This includes the $43,000 franchise fee and a significant $180,000 investment in branded service vehicles, plus a cash buffer to handle the $886,000 minimum cash point in June 2026.
The model shows a 7.57% Internal Rate of Return (IRR) and a 3.53 Return on Equity (ROE) over the five-year period. With a 3-year payback period, the investment is solid for an operator who can effectively manage a team of 4 to 6 technicians while maintaining brand standards.

The unit is projected to break even in January 2026, which is essentially the first month of full operation. This rapid break-even depends on hitting your $1.2M year-one revenue target, specifically driven by the $400,000 repair service stream and $250,000 in maintenance contracts.

The lowest cash point occurs in June 2026 at $886,000, reflecting the heavy upfront CAPEX for fleet and warehouse improvements. You need to maintain a disciplined cash buffer during the first six months to ensure you can cover the $313,000 annual technician payroll before the summer peak hits.

In a high-growth scenario, pushing system replacements can significantly boost your year-one $238,000 EBITDA. Still, a low-case scenario with higher parts costs or lower technician productivity will quickly squeeze your 1.8% payment processing and 2% fuel margins, delaying your 3-year payback.
Finance: update unit break-even and payback model by Friday.
This Excel-based tool is built for flexibility, allowing you to adjust every variable from technician headcount to local territory pricing. The pre-filled formulas and editable assumptions mean you can swap out regional labor rates or rent costs without breaking the logic, making it easy to adapt to your specific market conditions.

We mapped out a 60-month growth trajectory that scales from an initial $1.2M in annual sales to nearly $3M by year five. This long-term view captures the transition from a startup phase into a mature operation, providing clear visibility into net profit, cash flow, and the balance sheet as you expand your fleet.

Operating a brand-name unit comes with specific financial obligations that we have baked directly into the model. By accounting for a 6% royalty and a 1.5% marketing fund contribution, you can see the real-world impact of these fees on your store-level EBITDA before you commit to a territory.

Launching this concept requires a clear understanding of your upfront burn, including the $43,000 franchise fee and $180,000 for branded service vehicles. Our model calculates the exact sales volume and ticket size needed to cover these fixed costs, helping you plan your path to a sustainable margin.

We included researched benchmarks for key expenses like HVAC parts and refrigerants, which typically start around 11% of revenue. These built-in standards allow you to sanity-check your projections against industry norms, ensuring your labor and supply costs stay within a competitive range for the residential market.


Simply purchase and download the financial model template, then access it instantly using Microsoft Excel or Google Sheets. No installation or technical expertise required-just open and start working.

Enter your business-specific numbers, including revenue projections, costs, and investment details. The pre-built formulas will automatically calculate financial insights, saving you time and effort.

Leverage the investor-ready format to confidently showcase your financial projections to banks, franchise representatives, or investors. Impress stakeholders with clear, data-driven insights and professional reports.

Leverage the investor-ready format to confidently present your projections to banks, franchise representatives, or investors.