
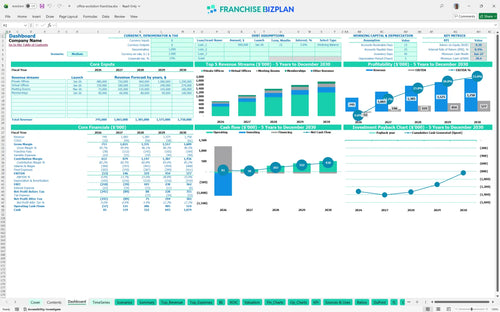
All-in-one Dashboard
Core inputs and core outputs


This Excel model for franchise business investment appraisal includes everything from detailed CAPEX schedules to 5-year EBITDA forecasts and monthly cash flow tracking.
Core inputs and core outputs
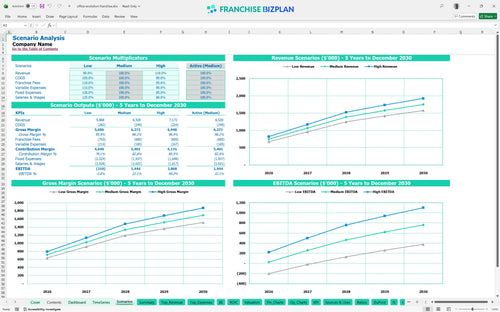
Three scenario analysis
Presentation ready
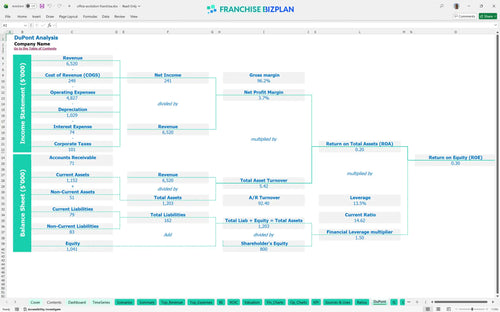
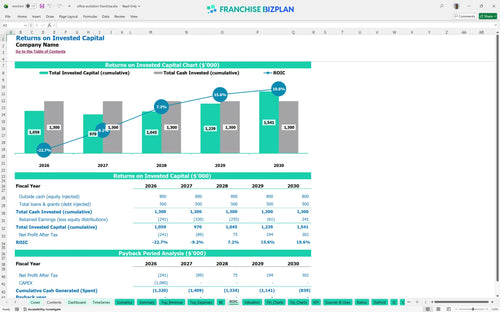
DuPont analysis
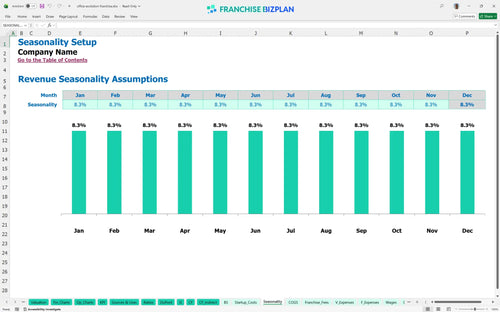
Researched revenue assumptions
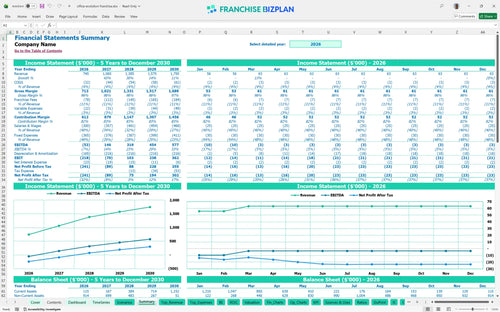
Lender-friendly financial outputs
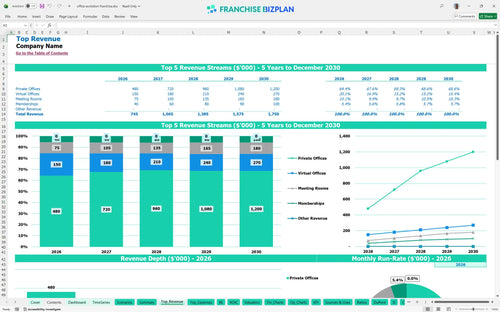
Revenue stream detailed view

Performance metrics benchmark
We built this franchise unit financial model using our own research to help you navigate the $1.75M revenue potential of a premium coworking location. Key assumptions like the $450,000 leasehold improvements, 7.5% royalty fees, and the $20,000 monthly rent are pre-populated with researched data and are fully editable. This tool ensures you understand the path to the Jan-26 break-even date and the long-term return on your investment.
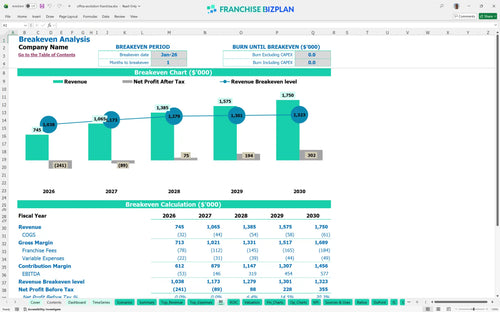
The unit is projected to reach positive Earnings Before Interest, Taxes, Depreciation, and Amortization (EBITDA) in Year 2, hitting $146,000 after a Year 1 loss of $53,000. While the model shows a monthly break-even as early as January 2026, true annual profitability requires scaling the private office revenue to at least $480,000. Timing your exit from the red is everything.
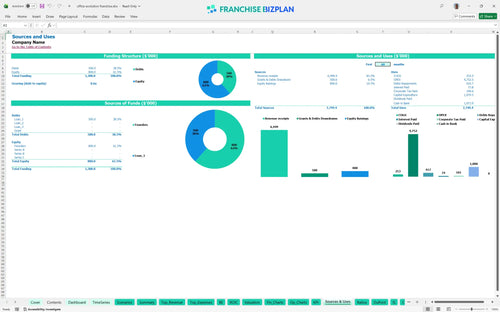
You will need significant upfront capital to launch this unit, with the total investment driven by a $49,500 franchise fee and over $1M in build-out and equipment costs. The largest allocation goes toward leasehold improvements and soundproofing to meet executive-level standards in a 15,000 square foot space. Build-out costs are your biggest hurdle.
Investors can expect an Internal Rate of Return (IRR) of 41% and a Return on Equity (ROE) of 0.3 over the five-year hold period. However, due to the high initial CAPEX, the full payback of the initial investment occurs after Year 5, even as annual EBITDA climbs toward $577,000. Patience is a virtue when your payback is past year five.
The unit hits its monthly break-even point in January 2026, provided the virtual office revenue model and private office leases launch on schedule. The primary driver for break-even is occupancy volume, as fixed costs like the $20,000 rent and $75,000 manager salary remain constant regardless of member count. Break-even is a volume game here.
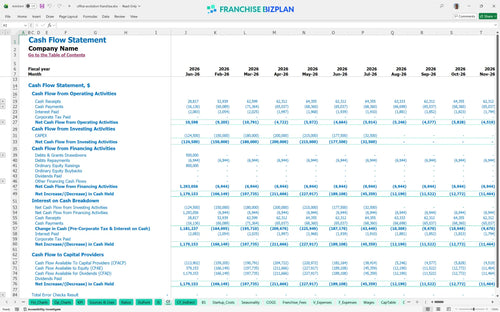
The lowest cash point is projected at $78,000 in January 2027, suggesting you need a solid working capital buffer to handle the first year of operations. This cash runway accounts for the ramp-up in staffing, including the addition of administrative and maintenance personnel as occupancy grows. Cash is king during the ramp-up.
Revenue forecasting for virtual office service providers and private offices shows a jump from $745,000 in Year 1 to $1.75M in Year 5, but a 10% dip in occupancy can delay payback by years. High-performance scenarios depend on maintaining a high average ticket for meeting rooms and keeping the 7.5% royalty burden manageable through scale. The high case requires perfect execution.
This coworking franchise financial model is built entirely in Excel with open formulas, so you can tweak every assumption to fit your specific territory. Whether you are adjusting the $20,000 monthly rent for a different market or changing the 7.5% royalty rate, the math updates instantly across all five years of projections. It is designed for operators who need to move beyond static PDFs and actually stress-test their shared office space business plan before signing a long-term commercial lease.

Our coworking space financial projections provide a clear roadmap from your first month through year five, showing revenue growing from $745,000 to $1,750,000. You can track how scaling from private offices to virtual office services impacts your bottom line as the unit matures. This long-range view is essential for commercial lease underwriting and showing lenders exactly how you plan to manage the ramp-up phase and eventual stabilization.

This model simplifies franchise unit economics by hard-coding the specific fees you will owe the franchisor, including the initial $49,500 franchise fee. It automatically calculates the 7.5% monthly royalty and 3% marketing fund contribution based on your projected gross sales, so you see the true net margin. Understanding these off-the-top costs is vital because they significantly impact your ability to cover local overhead like the $75,000 business manager salary.

The franchise startup cost template accounts for the heavy upfront Capital Expenditures (CAPEX), such as the $450,000 for leasehold improvements and $200,000 for soundproofing. By mapping these against your monthly fixed costs, the model identifies the exact revenue volume needed to stop the bleeding and start generating positive cash flow. Knowing your break-even point helps you manage the $78,000 minimum cash reserve defintely needed during the early months.

We have integrated industry-standard benchmarks for executive suite operations to help you verify if your $20,000 rent or $3,000 utility budget is realistic for a 15,000 square foot facility. These markers allow you to compare your projected labor costs, like the $55,000 sales coordinator, against typical franchise performance. It is a reality check that ensures your office suite franchise profitability analysis is grounded in real-world data rather than best-case guesses.


Simply purchase and download the financial model template, then access it instantly using Microsoft Excel or Google Sheets. No installation or technical expertise required-just open and start working.

Enter your business-specific numbers, including revenue projections, costs, and investment details. The pre-built formulas will automatically calculate financial insights, saving you time and effort.

Leverage the investor-ready format to confidently showcase your financial projections to banks, franchise representatives, or investors. Impress stakeholders with clear, data-driven insights and professional reports.

Leverage the investor-ready format to confidently present your projections to banks, franchise representatives, or investors.