
All-in-one Dashboard
Core inputs and core outputs


This Retail Franchise Financial Excel provides a dynamic dashboard, detailed P&L, cash flow statement, and automated charts to visualize your path to ROI and help with analyzing franchise investment feasibility.
Core inputs and core outputs
Three scenario analysis
Presentation ready
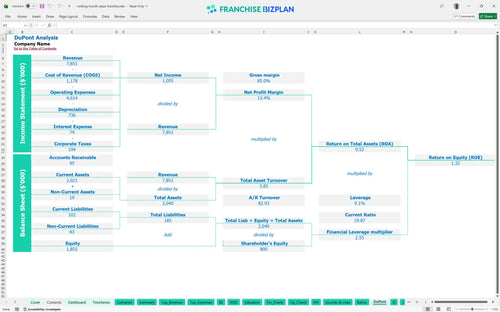
DuPont analysis
Researched revenue assumptions
Lender-friendly financial outputs
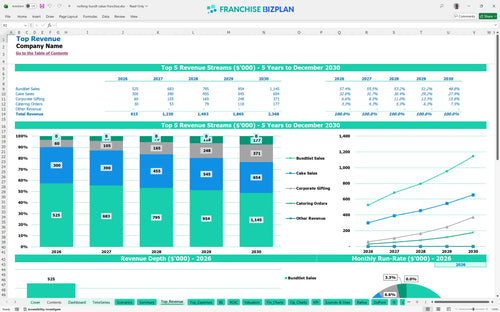
Revenue stream detailed view
Performance metrics benchmark
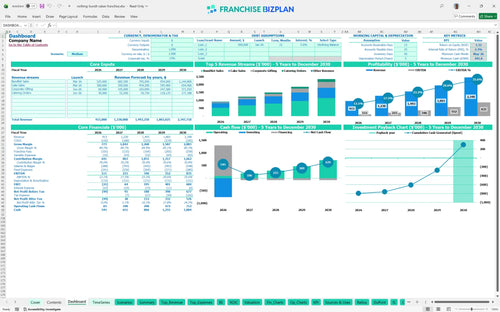
We built this Franchise Business Plan Template using detailed research on high-end dessert operations. Key assumptions like the $45,000 franchise fee, $15,000 monthly rent, and tiered staffing for bakery crews are pre-populated and fully editable. This model helps you visualize how $915,000 in year-one sales translates to a $111,000 EBITDA while managing a 5% marketing fund contribution.
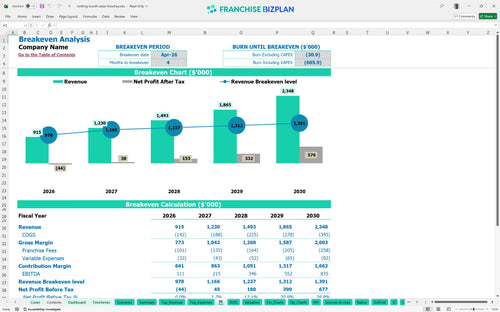
The unit reaches its break-even date in April 2026, just four months after the March launch. By year two, EBITDA jumps to $215,000 as corporate gifting and catering revenue streams mature. Net profit scales defintely as food ingredient costs drop from 13.5% to 12.7% through better waste management and higher throughput.
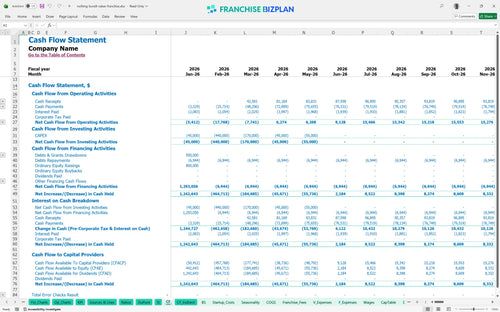
You need a total initial investment of $755,000 to cover the core build-out and equipment. This includes the $45,000 franchise fee and $350,000 for leasehold improvements. Your lowest cash point hits $492,000 in May 2026, so having a solid liquidity buffer is essential for the first few months of trading while you learn how to calculate startup costs for a bakery franchise.
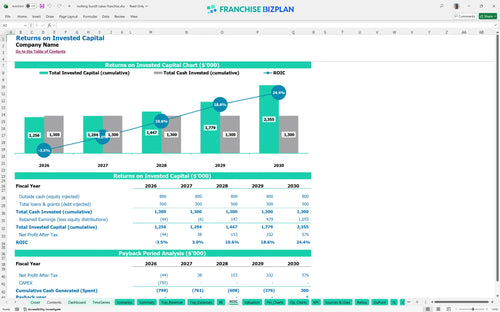
The model shows a 5-year payback period with an Internal Rate of Return (IRR) of 2.35%. While the initial ROI Analysis might seem conservative, the Return on Equity (ROE) sits at 1.32. This reflects the high upfront CAPEX required for a premium retail footprint and specialized baking setups, but the $835,000 EBITDA by year five shows the long-term prize.
You hit the break-even point in month 4, requiring enough volume to cover $15,000 in rent and $20,000+ in monthly wages. The biggest driver is the Bundtlet sales volume, which starts at $350,000 annually. If you miss your traffic targets, the 11% combined royalty and marketing burden makes the margin thin, so focus on how to forecast revenue for a dessert franchise accurately.
Your cash runway is tightest in May 2026, with a minimum cash balance of $492,000. This follows the heavy $755,000 CAPEX spend and initial ramp-up losses. We recommend a 20% contingency buffer to handle any construction delays or slower-than-expected local marketing results during the first 90 days of operation.
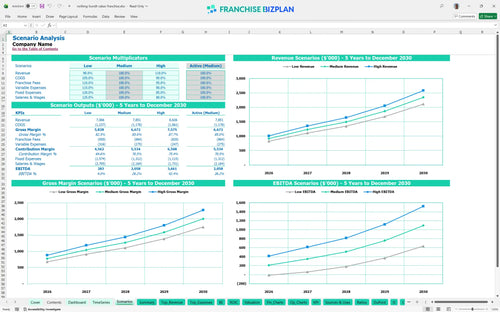
Moving from a $915,000 year-one revenue to a high-performance scenario significantly changes your ROI Analysis. The model allows you to stress-test COGS and labor; for example, a 1% drop in food costs adds thousands to the bottom line. High-volume scenarios see EBITDA margins expand rapidly as fixed costs like the $15,000 rent are leveraged over more units.
Finance: update unit break-even and payback model by Friday.
This Excel-based Franchise Financial Model lets you swap out every assumption to match your specific market. You can adjust the $15,000 monthly rent or the $65,000 manager salary to see how local labor markets impact your bottom line. It is built for real-world testing, making it the best financial model template for retail franchises looking to move beyond generic estimates.

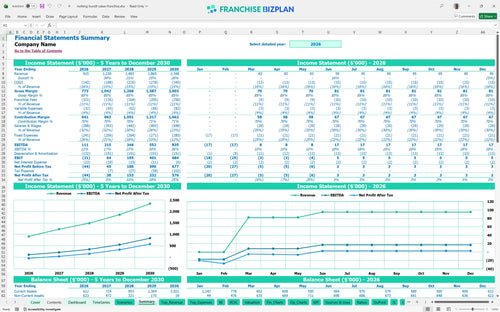
Moving from a $915,000 first-year revenue to $2.348 million by year five requires a clear roadmap. This model tracks your scale, showing how EBITDA grows from $111,000 to $835,000 as you mature. It maps out the long-term trajectory so you can see when the unit truly starts throwing off significant cash and helps with estimating monthly operating expenses for a franchise.

Royalties and marketing funds are non-negotiable costs that eat into your margin every month. This tool calculates the 6% Royalty Fee and 5% Marketing Fee automatically based on your sales volume. It ensures you account for every dollar owed to the franchisor before you calculate your take-home pay, providing a clear bakery franchise profitability analysis excel users can trust.

Launching a premium bakery requires significant upfront capital, including $350,000 for leasehold improvements and $180,000 for baking equipment. This model identifies your Break-Even Point, which occurs around April 2026 in our baseline. Knowing exactly when your daily Bundtlet and cake sales cover your fixed costs is vital for survival and is a core part of any franchise unit economic modeling guide.

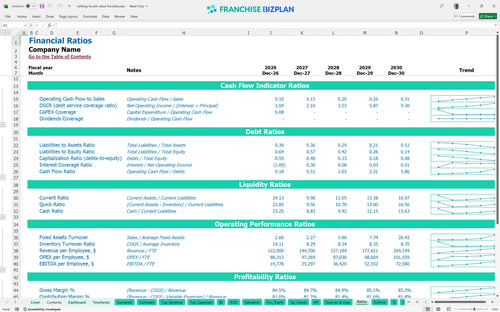
Don't guess if your 13.5% food ingredient cost is competitive. The model includes benchmarks to help you sanity-check your Bakery Franchise Profitability against industry standards. It highlights where your labor or occupancy costs might be out of alignment, allowing for quick operational pivots and more accurate financial planning tools for new franchise owners.


Simply purchase and download the financial model template, then access it instantly using Microsoft Excel or Google Sheets. No installation or technical expertise required-just open and start working.

Enter your business-specific numbers, including revenue projections, costs, and investment details. The pre-built formulas will automatically calculate financial insights, saving you time and effort.

Leverage the investor-ready format to confidently showcase your financial projections to banks, franchise representatives, or investors. Impress stakeholders with clear, data-driven insights and professional reports.

Leverage the investor-ready format to confidently present your projections to banks, franchise representatives, or investors.