


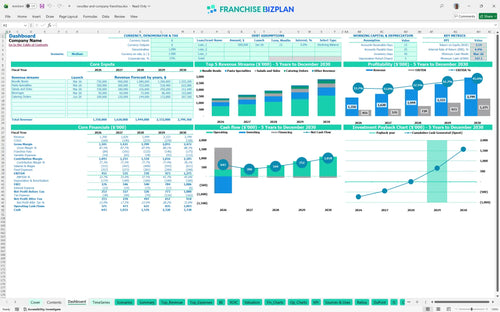
All-in-one Dashboard
Core inputs and core outputs



This restaurant financial projections excel tool provides a complete pro forma suite, including automated 5-year P&L, cash flow, and startup cost tracking for a single-unit franchise operation.
Core inputs and core outputs
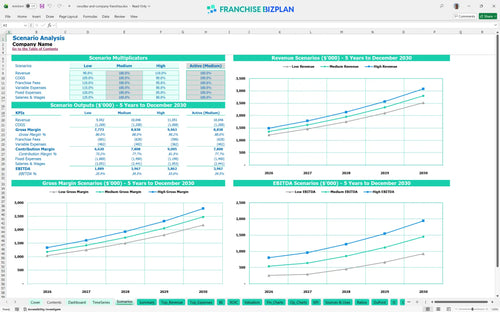
Three scenario analysis
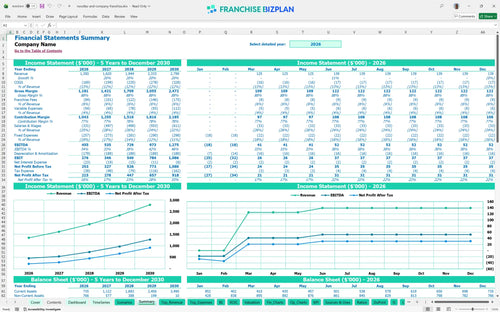
Presentation ready

DuPont analysis
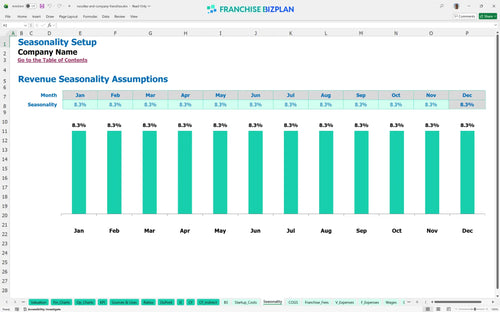
Researched revenue assumptions
Lender-friendly financial outputs
Revenue stream detailed view
Performance metrics benchmark
We built this franchise unit financial model using our own research to reflect the actual economics of this fast-casual concept. Key assumptions like the $1.35M Year 1 revenue and the 5% royalty fee are pre-populated and fully editable to match your specific location. This model helps you move from guessing to making data-driven decisions about your investment.
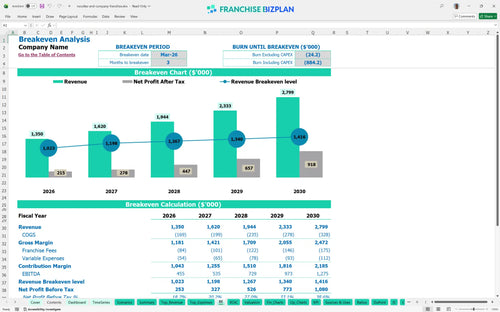
You reach the break-even date in March 2026, just three months after the official launch. By Year 1, the model projects an EBITDA for restaurants of $455,000, which scales up to $1,275,000 by Year 5 as revenue grows. Your franchise unit profitability analysis depends on hitting these ramp-up targets early.
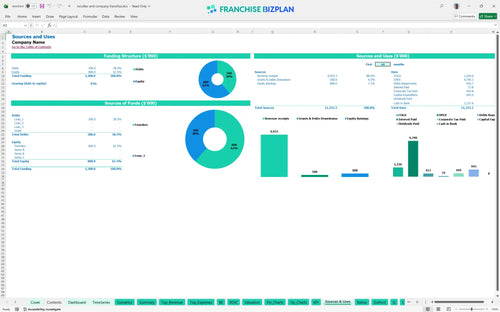
You need $945,000 to launch this unit, which covers the $35,000 franchise fee and significant restaurant franchise startup costs. The largest outlays include $450,000 for leasehold improvements and $250,000 for kitchen equipment. You also need to maintain a minimum cash balance of $327,000 to handle the initial operating cycle.
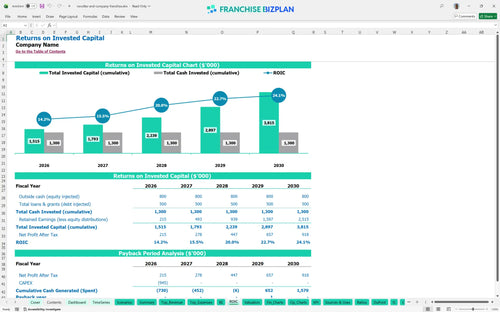
The franchise investment ROI shows a 4-year payback period on your total initial capital. With an Internal Rate of Return (IRR) of 4.41% and a Return on Equity (ROE) of 3.14%, the model provides a conservative look at your long-term gains. Honestly, the returns are stable but require tight management of the $16,000 monthly rent.
The restaurant franchise break-even analysis template points to March 2026 as the critical month for sustainability. To cover fixed costs like the $16,000 monthly rent and the $155,000+ annual management salaries, you must hit your volume targets quickly. Throughput during the lunch rush is the biggest driver for covering these fixed obligations.
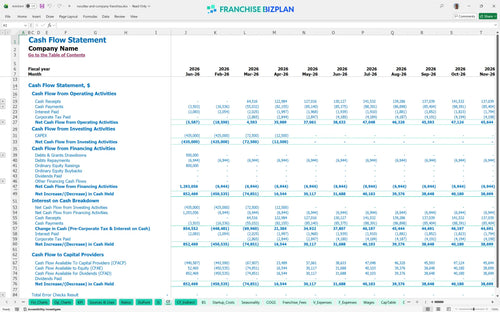
The lowest cash point occurs in March 2026 at $327,000, which is your most vulnerable period. You need enough runway to survive the first 90 days before the unit becomes cash-flow positive. If estimating catering revenue for restaurant franchise locations falls short, that cash buffer becomes your primary safety net.
This Excel template for fast casual restaurant financial forecasting lets you stress-test your franchise business plan financial projections. A High case assumes you smash the $100,000 catering goal, while a Low case shows how a revenue dip impacts your 4-year payback. Pro forma financial statements for new restaurant franchise owners must account for these market swings.
This franchise financial model template is built in Excel to give you total control over your projections. You can swap out the pre-filled assumptions for your specific territory, adjusting everything from local labor rates to specific lease terms without breaking the math. It is a flexible tool designed to handle the unique variables of a fast-casual environment.

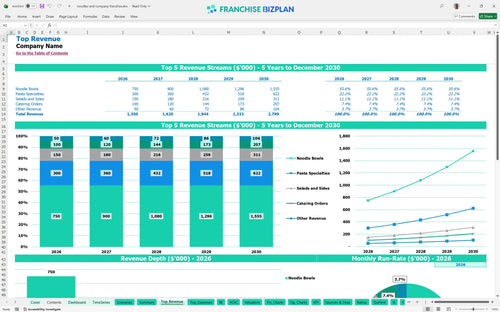
Planning a fast casual restaurant business plan requires looking past the grand opening to see long-term viability. This model tracks your trajectory from a Year 1 revenue of $1,350,000 up to $2,799,000 by Year 5, providing a clear P&L statement template to monitor how scaling affects your bottom line. You need to see how the margins evolve as the unit matures over half a decade.

We baked in the specific franchise royalty fees calculation so you aren't surprised by the off-the-top costs that eat into your cash flow. With a 5% royalty and a 1.25% marketing fund, the model shows exactly how much of your $1.35M Year 1 revenue goes back to the franchisor. Analyzing franchise royalty and marketing fees in excel helps you see the actual store-level margin available for debt service.

Knowing how to calculate startup costs for a restaurant franchise is the difference between a smooth launch and a mid-year cash crunch. This tool aggregates your $945,000 initial investment, covering everything from the $35,000 franchise fee to the $450,000 in leasehold improvements. Our restaurant franchise break-even analysis template shows you exactly when the doors start paying for themselves.

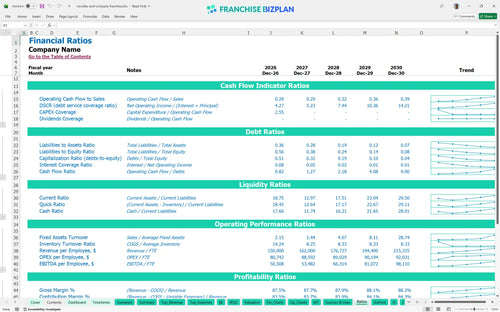
This restaurant franchise unit economic model includes built-in benchmarks to keep your projections grounded in reality. If your food costs deviate significantly from the 11% target or labor drifts too far from the plan, the model flags it for review. It serves as a vital sanity check for your operating expense ratio against typical fast-casual performance standards.


Simply purchase and download the financial model template, then access it instantly using Microsoft Excel or Google Sheets. No installation or technical expertise required-just open and start working.

Enter your business-specific numbers, including revenue projections, costs, and investment details. The pre-built formulas will automatically calculate financial insights, saving you time and effort.

Leverage the investor-ready format to confidently showcase your financial projections to banks, franchise representatives, or investors. Impress stakeholders with clear, data-driven insights and professional reports.

Leverage the investor-ready format to confidently present your projections to banks, franchise representatives, or investors.