
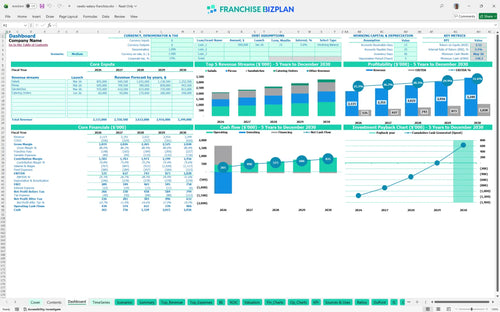
All-in-one Dashboard
Core inputs and core outputs


This comprehensive financial tool includes automated pro-forma statements, CAPEX schedules, and detailed labor modules designed specifically for fast-casual operators.
Core inputs and core outputs
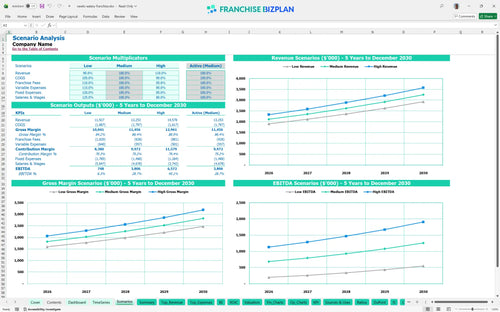
Three scenario analysis
Presentation ready
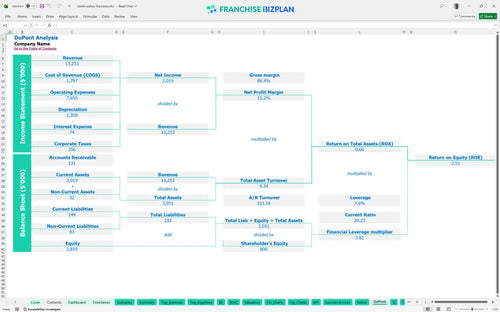
DuPont analysis
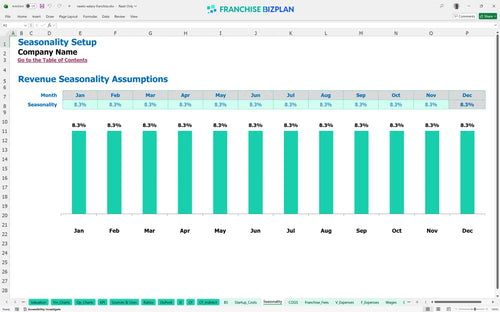
Researched revenue assumptions
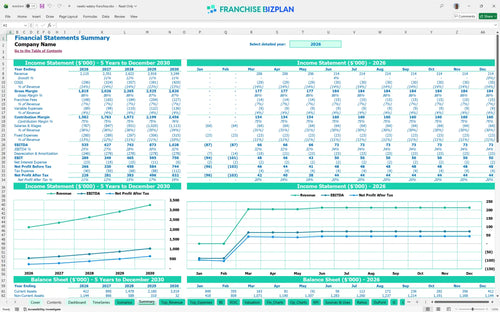
Lender-friendly financial outputs
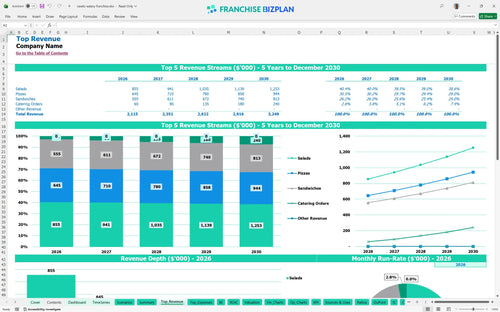
Revenue stream detailed view
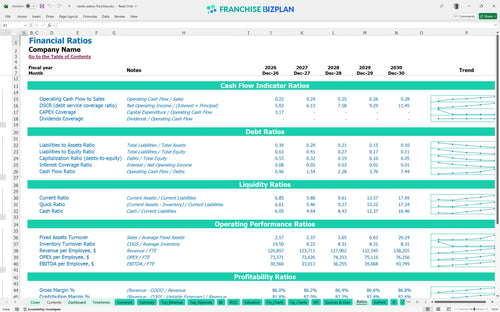
Performance metrics benchmark
We developed this model using detailed research to ensure your projections reflect the reality of this fast-casual concept. Key assumptions like estimating labor and food costs for new franchise units and tracking catering revenue in restaurant financial models are pre-populated, including Year 1 revenue of $2,115,000 and a 5% royalty structure. Everything is fully editable so you can adjust for your specific local market demand.
Based on our restaurant profitability analysis, this unit becomes profitable in its first year of operation. After accounting for food costs starting at 12% and fixed expenses like the $16,000 monthly rent, the model shows a Year 1 EBITDA of $535,000. Profitability depends on keeping food costs under 12%.
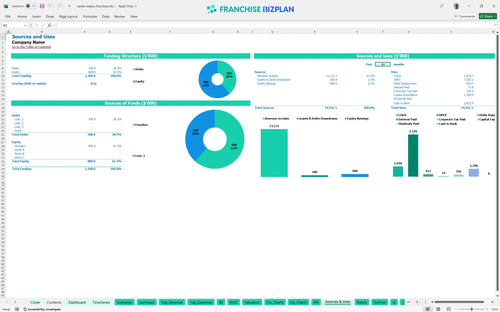
To launch this unit in the US, you need a total initial investment of $1,390,000. This capital expenditure budget covers the $40,000 franchise fee, $700,000 for leasehold improvements, and $250,000 for kitchen equipment. A $1.39M start requires a tight grip on leasehold costs.
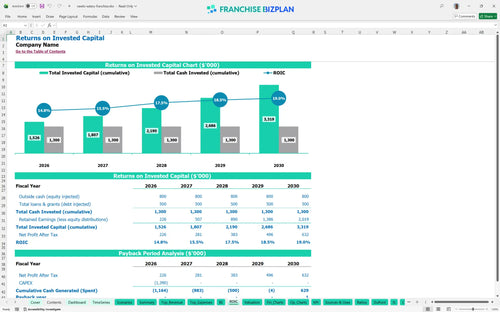
Using our franchise investment calculator, the model projects an Internal Rate of Return (IRR) of 3.1% and a Return on Equity (ROE) of 2.52. The total payback period is estimated at 5 years based on the steady climb to a Year 5 EBITDA of $1,028,000. A five-year payback requires disciplined execution.
The unit hits its monthly break-even point in April 2026, just 4 months after opening. This assumes you hit your monthly revenue target of approximately $176,250 to cover fixed costs and the 7% combined royalty and marketing burden. Four months to break-even is a fast sprint.
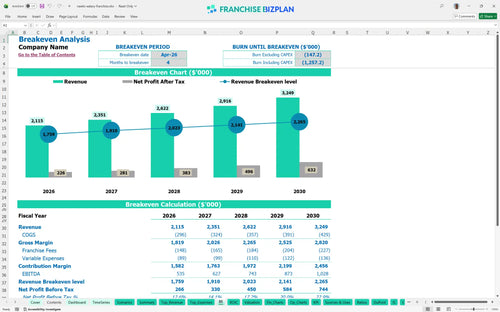
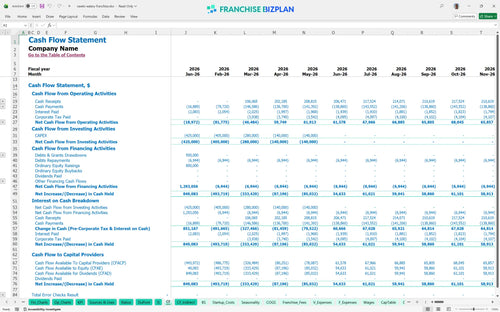
The lowest cash point occurs in May 2026, with a minimum cash balance of -$150,000 during the initial ramp-up. You defintely need a working capital buffer to handle this dip before the Year 1 cash flow stabilizes. Managing the $150k dip is your first big test.
Financial modeling for multi-unit franchise owners shows that a 10% drop in revenue can delay payback by over a year. Conversely, hitting the High scenario through better local marketing execution can push Year 1 EBITDA well past the $535,000 baseline. Scenarios turn guesses into a real strategy.
Finance: update unit break-even and payback model by Friday
This franchise financial model template is built in Excel to give you total control over your numbers. You can easily adjust the pre-filled formulas and editable assumptions to match your specific territory, whether you are preparing a business plan for a restaurant franchise loan or just testing a new site. Control your numbers before the bank does.

Long-term planning is the difference between a single store and a small empire. This model provides detailed 5-year revenue, cost, and cash flow views, which is essential for any franchise business plan Excel. Five years is a lifetime in food, so plan for it.

We built this to handle the heavy lifting of franchise-specific costs like the 5% royalty and 2% marketing fund fees. By integrating these into your franchise disclosure document analysis, you see the true store-level margin after the franchisor takes their cut. Royalties are a top-line tax you can't ignore.

Estimating restaurant franchise startup costs requires precision, from the $40,000 initial fee to the $700,000 leasehold improvements. Our break-even analysis shows exactly what sales volume you need to cover your $16,000 monthly rent and variable costs. Knowing your floor is as vital as knowing your ceiling.

This model uses restaurant unit economics to help you sanity-check your labor and food cost assumptions against industry standards. If your projections drift too far from the norm, the model helps you spot the leak before you sign the lease. Don't fly blind when others have already mapped the sky.


Simply purchase and download the financial model template, then access it instantly using Microsoft Excel or Google Sheets. No installation or technical expertise required-just open and start working.

Enter your business-specific numbers, including revenue projections, costs, and investment details. The pre-built formulas will automatically calculate financial insights, saving you time and effort.

Leverage the investor-ready format to confidently showcase your financial projections to banks, franchise representatives, or investors. Impress stakeholders with clear, data-driven insights and professional reports.

Leverage the investor-ready format to confidently present your projections to banks, franchise representatives, or investors.